Cablevision 2012 Annual Report Download - page 59
Download and view the complete annual report
Please find page 59 of the 2012 Cablevision annual report below. You can navigate through the pages in the report by either clicking on the pages listed below, or by using the keyword search tool below to find specific information within the annual report.-
 1
1 -
2
-
3
-
4
-
5
-
6
-
7
-
8
-
9
-
10
-
11
-
12
-
13
-
14
-
15
-
16
-
17
-
18
-
19
-
20
-
21
-
22
-
23
-
24
-
25
-
26
-
27
-
28
-
29
-
30
-
31
-
32
-
33
-
34
-
35
-
36
-
37
-
38
-
39
-
40
-
41
-
42
-
43
-
44
-
45
-
46
-
47
-
48
-
 49
49 -
 50
50 -
 51
51 -
 52
52 -
 53
53 -
 54
54 -
 55
55 -
 56
56 -
 57
57 -
 58
58 -
 59
59 -
 60
60 -
 61
61 -
 62
62 -
 63
63 -
 64
64 -
 65
65 -
 66
66 -
 67
67 -
 68
68 -
 69
69 -
70
-
71
-
72
-
73
-
74
-
75
-
76
-
77
-
78
-
79
-
80
-
81
-
82
-
83
-
84
-
85
-
86
-
87
-
88
-
89
-
90
-
91
-
92
-
93
-
94
-
95
-
96
-
97
-
98
-
99
-
100
-
101
-
102
-
103
-
104
-
105
-
106
-
107
-
108
-
109
-
110
-
111
-
112
-
113
-
114
-
115
-
116
-
117
-
118
-
119
-
120
-
121
-
122
-
123
-
124
-
125
-
126
-
127
-
128
-
129
-
130
-
131
-
132
-
133
-
134
-
135
-
136
-
137
-
138
-
139
-
140
-
141
-
142
-
143
-
144
-
145
-
146
-
147
-
148
-
149
-
150
-
151
-
152
-
153
-
154
-
155
-
156
-
157
-
158
-
159
-
160
-
161
-
162
-
163
-
164
-
165
-
166
-
167
-
168
-
169
-
170
-
171
-
172
-
173
-
174
-
175
-
176
-
177
-
178
-
179
-
180
-
181
-
182
-
183
-
184
-
185
-
186
-
187
-
188
-
189
-
190
-
191
-
192
-
193
-
194
-
195
-
196
-
197
-
198
-
199
-
200
-
201
-
202
-
203
-
204
-
205
-
206
-
207
-
208
-
209
-
210
-
211
-
212
-
213
-
214
-
215
-
216
-
217
-
218
-
219
-
220
 |
 |

(53)
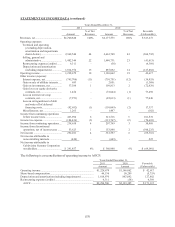
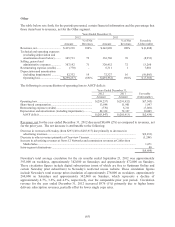
STATEMENT OF INCOME DATA (continued)
Years Ended December 31,
2011 2010
% of Net % of Net Favorable
Amount Revenues Amount Revenues (Unfavorable)
Revenues, net ...................................... $6,700,848 100% $6,177,575 100% $ 523,273
Operating expenses:
Technical and operating
(excluding depreciation,
amortization and impairments
shown below) .............................. 2,968,540 44 2,663,748 43 (304,792)
Selling, general and
administrative .............................. 1,482,344 22 1,440,731 23 (41,613)
Restructuring expense (credits) ....... 6,311 - (58) - (6,369)
Depreciation and amortization
(including impairments) .............. 1,014,974 15 887,092 14 (127,882)
Operating income ................................ 1,228,679 18 1,186,062 19 42,617
Other income (expense):
Interest expense, net ........................ (745,706) (11) (710,751) (12) (34,955)
Gain on sale of affiliate interests ..... 683 - 2,051 - (1,368)
Gain on investments, net ................. 37,384 1 109,813 2 (72,429)
Gain (loss) on equity derivative
contracts, net................................ 1,454 - (72,044) (1) 73,498
Loss on interest rate swap
contracts, net................................ (7,973) - (85,013) (1) 77,040
Loss on extinguishment of debt
and write-off of deferred
financing costs ............................. (92,692) (1) (110,049) (2) 17,357
Miscellaneous, net ........................... 1,265 - 1,447 - (182)
Income from continuing operations
before income taxes ........................ 423,094 6 321,516 5 101,578
Income tax expense ............................ (184,436) (3) (113,767) (2) (70,669)
Income from continuing operations .... 238,658 4 207,749 3 30,909
Income from discontinued
operations, net of income taxes ...... 53,623 1 153,848 2 (100,225)
Net income ......................................... 292,281 4 361,597 6 (69,316)
Net income attributable to
noncontrolling interests .................. (424) - (649) - 225
Net income attributable to
Cablevision Systems Corporation
stockholders .................................... $ 291,857 4% $ 360,948 6% $ (69,091)
The following is a reconciliation of operating income to AOCF:
Years Ended December 31,
2011 2010 Favorable
Amount Amount (Unfavorable)
Operating income ............................................................................
.
$1,228,679 $1,186,062 $ 42,617
Share-based compensation ..............................................................
.
44,536 50,289 (5,753)
Depreciation and amortization (including impairments) .................
.
1,014,974 887,092 127,882
Restructuring expense (credits) .......................................................
.
6,311 (58) 6,369
AOCF ..........................................................................................
.
$2,294,500 $2,123,385 $ 171,115