Cablevision 2012 Annual Report Download - page 208
Download and view the complete annual report
Please find page 208 of the 2012 Cablevision annual report below. You can navigate through the pages in the report by either clicking on the pages listed below, or by using the keyword search tool below to find specific information within the annual report.-
 1
1 -
2
-
3
-
4
-
5
-
6
-
7
-
8
-
9
-
10
-
11
-
12
-
13
-
14
-
15
-
16
-
17
-
18
-
19
-
20
-
21
-
22
-
23
-
24
-
25
-
26
-
27
-
28
-
29
-
30
-
31
-
32
-
33
-
34
-
35
-
36
-
37
-
38
-
39
-
40
-
41
-
42
-
43
-
44
-
45
-
46
-
47
-
48
-
49
-
50
-
51
-
52
-
53
-
54
-
55
-
56
-
57
-
58
-
59
-
60
-
61
-
62
-
63
-
64
-
65
-
66
-
67
-
68
-
69
-
70
-
71
-
72
-
73
-
74
-
75
-
76
-
77
-
78
-
79
-
80
-
81
-
82
-
83
-
84
-
85
-
86
-
87
-
88
-
89
-
90
-
91
-
92
-
93
-
94
-
95
-
96
-
97
-
98
-
99
-
100
-
101
-
102
-
103
-
104
-
105
-
106
-
107
-
108
-
109
-
110
-
111
-
112
-
113
-
114
-
115
-
116
-
117
-
118
-
119
-
120
-
121
-
122
-
123
-
124
-
125
-
126
-
127
-
128
-
129
-
130
-
131
-
132
-
133
-
134
-
135
-
136
-
137
-
138
-
139
-
140
-
141
-
142
-
143
-
144
-
145
-
146
-
147
-
148
-
149
-
150
-
151
-
152
-
153
-
154
-
155
-
156
-
157
-
158
-
159
-
160
-
161
-
162
-
163
-
164
-
165
-
166
-
167
-
168
-
169
-
170
-
171
-
172
-
173
-
174
-
175
-
176
-
177
-
178
-
179
-
180
-
181
-
182
-
183
-
184
-
185
-
186
-
187
-
188
-
189
-
190
-
191
-
192
-
193
-
194
-
195
-
196
-
197
-
 198
198 -
 199
199 -
 200
200 -
 201
201 -
 202
202 -
 203
203 -
 204
204 -
 205
205 -
 206
206 -
 207
207 -
 208
208 -
 209
209 -
 210
210 -
 211
211 -
 212
212 -
 213
213 -
 214
214 -
 215
215 -
 216
216 -
 217
217 -
 218
218 -
219
-
220
 |
 |

COMBINED NOTES TO CONSOLIDATED FINANCIAL STATEMENTS (continued)
(Dollars in thousands, except per share amounts)
I-80
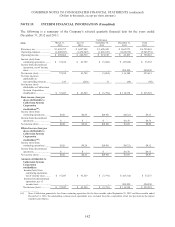
Information as to the operations of the Company's reportable business segments is set forth below.
Years Ended December 31,
2012 2011 2010
Revenues, net from continuing operations
Telecommunications Services .................................................. $6,292,194 $ 6,279,653 $5,735,522
Other ......................................................................................... 435,210 443,898 465,975
Inter-segment eliminations(a) ................................................... (21,943) (22,703) (23,922)
$6,705,461 $ 6,700,848 $6,177,575
Inter-segment revenues
Telecommunications Services .................................................. $ 2,190 $ 2,153 $ 2,500
Other ......................................................................................... 19,753 20,550 21,422
$ 21,943 $ 22,703 $ 23,922
Adjusted operating cash flow (deficit) from continuing
operations
Telecommunications Services .................................................. $ 2,103,167 $ 2,495,913 $2,331,638
Other ......................................................................................... (203,847) (201,413) (208,253)
$ 1,899,320 $ 2,294,500 $2,123,385
Depreciation and amortization (including impairments)
included in continuing operations
Telecommunications Services .................................................. $ (996,625) $ (942,647) $ (824,029)
Other ......................................................................................... (82,332) (72,327) (63,063)
$(1,078,957) $(1,014,974) $ (887,092)
Share-based compensation expense included in continuing
operations
Telecommunications Services .................................................. $ (47,775) $ (32,635) $ (33,885)
Other ......................................................................................... (13,848) (11,901) (16,404)
$ (61,623) $ (44,536) $ (50,289)
Restructuring credits (expense) included in continuing
operations
Telecommunications Services .................................................. $ - $ - $ -
Other(b)..................................................................................... 770 (6,311) 58
$ 770 $ (6,311) $ 58
Operating income (loss) from continuing operations
Telecommunications Services .................................................. $1,058,767 $ 1,520,631 $1,473,724
Other ......................................................................................... (299,257) (291,952) (287,662)
$ 759,510 $ 1,228,679 $1,186,062
________________
(a) Inter-segment eliminations relate primarily to revenues recognized from the sale of local programming services to
the Company's Telecommunications Services segment.
(b) The $6,311 restructuring expense recognized in 2011 related to the elimination of 97 positions, primarily within the
Newsday business of which approximately $1,600 remained unpaid as of December 31, 2012.