Cablevision 2012 Annual Report Download - page 135
Download and view the complete annual report
Please find page 135 of the 2012 Cablevision annual report below. You can navigate through the pages in the report by either clicking on the pages listed below, or by using the keyword search tool below to find specific information within the annual report.-
 1
1 -
2
-
3
-
4
-
5
-
6
-
7
-
8
-
9
-
10
-
11
-
12
-
13
-
14
-
15
-
16
-
17
-
18
-
19
-
20
-
21
-
22
-
23
-
24
-
25
-
26
-
27
-
28
-
29
-
30
-
31
-
32
-
33
-
34
-
35
-
36
-
37
-
38
-
39
-
40
-
41
-
42
-
43
-
44
-
45
-
46
-
47
-
48
-
49
-
50
-
51
-
52
-
53
-
54
-
55
-
56
-
57
-
58
-
59
-
60
-
61
-
62
-
63
-
64
-
65
-
66
-
67
-
68
-
69
-
70
-
71
-
72
-
73
-
74
-
75
-
76
-
77
-
78
-
79
-
80
-
81
-
82
-
83
-
84
-
85
-
86
-
87
-
88
-
89
-
90
-
91
-
92
-
93
-
94
-
95
-
96
-
97
-
98
-
99
-
100
-
101
-
102
-
103
-
104
-
105
-
106
-
107
-
108
-
109
-
110
-
111
-
112
-
113
-
114
-
115
-
116
-
117
-
118
-
119
-
120
-
121
-
122
-
123
-
124
-
 125
125 -
 126
126 -
 127
127 -
 128
128 -
 129
129 -
 130
130 -
 131
131 -
 132
132 -
 133
133 -
 134
134 -
 135
135 -
 136
136 -
 137
137 -
 138
138 -
 139
139 -
 140
140 -
 141
141 -
 142
142 -
 143
143 -
 144
144 -
 145
145 -
146
-
147
-
148
-
149
-
150
-
151
-
152
-
153
-
154
-
155
-
156
-
157
-
158
-
159
-
160
-
161
-
162
-
163
-
164
-
165
-
166
-
167
-
168
-
169
-
170
-
171
-
172
-
173
-
174
-
175
-
176
-
177
-
178
-
179
-
180
-
181
-
182
-
183
-
184
-
185
-
186
-
187
-
188
-
189
-
190
-
191
-
192
-
193
-
194
-
195
-
196
-
197
-
198
-
199
-
200
-
201
-
202
-
203
-
204
-
205
-
206
-
207
-
208
-
209
-
210
-
211
-
212
-
213
-
214
-
215
-
216
-
217
-
218
-
219
-
220
 |
 |

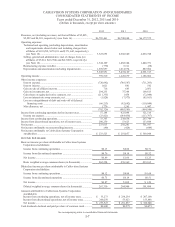
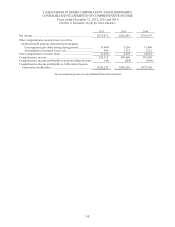
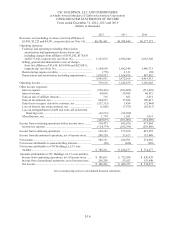
CABLEVISION SYSTEMS CORPORATION AND SUBSIDIARIES
CONSOLIDATED STATEMENTS OF INCOME
Years ended December 31, 2012, 2011 and 2010
(Dollars in thousands, except per share amounts)
I-7
2012 2011 2010
Revenues, net (including revenues, net from affiliates of $5,805,
$5,222 and $4,381, respectively) (see Note 16) ..............................
.
$6,705,461 $6,700,848 $6,177,575
Operating expenses:
Technical and operating (excluding depreciation, amortization
and impairments shown below and including charges from
affiliates of $183,292, $178,831 and $171,642, respectively)
(see Note 16) ...............................................................................
.
3,323,655 2,968,540 2,663,748
Selling, general and administrative (net of charges from (to)
affiliates of $3,614, $(16,994) and $(23,083), respectively)
(see Note 16) ...............................................................................
.
1,544,109 1,482,344 1,440,731
Restructuring expense (credits) .......................................................
.
(770) 6,311 (58)
Depreciation and amortization (including impairments) .................
.
1,078,957 1,014,974 887,092
5,945,951 5,472,169 4,991,513
Operating income ................................................................................
.
759,510 1,228,679 1,186,062
Other income (expense):
Interest expense ...............................................................................
.
(720,692) (746,587) (711,293)
Interest income ................................................................................
.
1,021 881 542
Gain on sale of affiliate interests .....................................................
.
716 683 2,051
Gain on investments, net .................................................................
.
294,235 37,384 109,813
Gain (loss) on equity derivative contracts, net ................................
.
(211,335) 1,454 (72,044)
Loss on interest rate swap contracts, net .........................................
.
(1,828) (7,973) (85,013)
Loss on extinguishment of debt and write-off of deferred
financing costs ...........................................................................
.
(66,213) (92,692) (110,049)
Miscellaneous, net ...........................................................................
.
1,770 1,265 1,447
(702,326) (805,585) (864,546)
Income from continuing operations before income taxes ....................
.
57,184 423,094 321,516
Income tax expense .........................................................................
.
(23,821) (184,436) (113,767)
Income from continuing operations .....................................................
.
33,363 238,658 207,749
Income from discontinued operations, net of income taxes .................
.
200,250 53,623 153,848
Net income ..........................................................................................
.
233,613 292,281 361,597
Net income attributable to noncontrolling interests .............................
.
(90) (424) (649)
Net income attributable to Cablevision Systems Corporation
stockholders ....................................................................................
.
$ 233,523 $ 291,857 $ 360,948
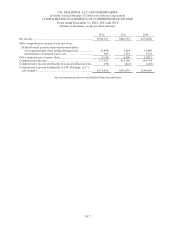
INCOME PER SHARE:
Basic net income per share attributable to Cablevision Systems
Corporation stockholders:
Income from continuing operations .................................................
.
$0.13 $0.86 $0.71
Income from discontinued operations .............................................
.
$0.76 $0.19 $0.52
Net income ......................................................................................
.
$0.89 $1.06 $1.23
Basic weighted average common shares (in thousands) ..................
.
262,258 276,369 293,165
Diluted net income per share attributable to Cablevision Systems
Corporation stockholders:
Income from continuing operations .................................................
.
$0.12 $0.84 $ 0.69
Income from discontinued operations .............................................
.
$0.75 $0.19 $0.51
Net income ......................................................................................
.
$0.87 $1.02 $ 1.20
Diluted weighted average common shares (in thousands) ...............
.
267,330 284,904 301,880
Amounts attributable to Cablevision Systems Corporation
stockholders:
Income from continuing operations, net of income taxes ................
.
$ 33,273 $ 238,234 $ 207,100
Income from discontinued operations, net of income taxes .............
.
200,250 53,623 153,848
Net income ......................................................................................
.
$ 233,523 $ 291,857 $ 360,948
Cash dividends declared and paid per share of common stock ............
.
$0.600 $0.575 $0.475
See accompanying notes to consolidated financial statements.