Cablevision 2012 Annual Report Download - page 81
Download and view the complete annual report
Please find page 81 of the 2012 Cablevision annual report below. You can navigate through the pages in the report by either clicking on the pages listed below, or by using the keyword search tool below to find specific information within the annual report.-
 1
1 -
2
-
3
-
4
-
5
-
6
-
7
-
8
-
9
-
10
-
11
-
12
-
13
-
14
-
15
-
16
-
17
-
18
-
19
-
20
-
21
-
22
-
23
-
24
-
25
-
26
-
27
-
28
-
29
-
30
-
31
-
32
-
33
-
34
-
35
-
36
-
37
-
38
-
39
-
40
-
41
-
42
-
43
-
44
-
45
-
46
-
47
-
48
-
49
-
50
-
51
-
52
-
53
-
54
-
55
-
56
-
57
-
58
-
59
-
60
-
61
-
62
-
63
-
64
-
65
-
66
-
67
-
68
-
69
-
70
-
 71
71 -
 72
72 -
 73
73 -
 74
74 -
 75
75 -
 76
76 -
 77
77 -
 78
78 -
 79
79 -
 80
80 -
 81
81 -
 82
82 -
 83
83 -
 84
84 -
 85
85 -
 86
86 -
 87
87 -
 88
88 -
 89
89 -
 90
90 -
 91
91 -
92
-
93
-
94
-
95
-
96
-
97
-
98
-
99
-
100
-
101
-
102
-
103
-
104
-
105
-
106
-
107
-
108
-
109
-
110
-
111
-
112
-
113
-
114
-
115
-
116
-
117
-
118
-
119
-
120
-
121
-
122
-
123
-
124
-
125
-
126
-
127
-
128
-
129
-
130
-
131
-
132
-
133
-
134
-
135
-
136
-
137
-
138
-
139
-
140
-
141
-
142
-
143
-
144
-
145
-
146
-
147
-
148
-
149
-
150
-
151
-
152
-
153
-
154
-
155
-
156
-
157
-
158
-
159
-
160
-
161
-
162
-
163
-
164
-
165
-
166
-
167
-
168
-
169
-
170
-
171
-
172
-
173
-
174
-
175
-
176
-
177
-
178
-
179
-
180
-
181
-
182
-
183
-
184
-
185
-
186
-
187
-
188
-
189
-
190
-
191
-
192
-
193
-
194
-
195
-
196
-
197
-
198
-
199
-
200
-
201
-
202
-
203
-
204
-
205
-
206
-
207
-
208
-
209
-
210
-
211
-
212
-
213
-
214
-
215
-
216
-
217
-
218
-
219
-
220
 |
 |
(75)
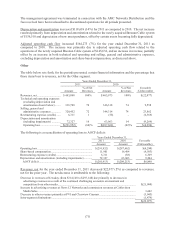
senior notes of $750,000, net proceeds from collateralized indebtedness and related derivative contracts of
$29,634 and cash receipts from proceeds from stock option exercises of $18,722.
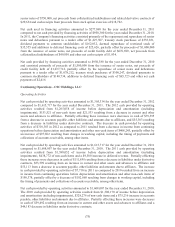
Net cash used in financing activities amounted to $277,868 for the year ended December 31, 2011
compared to net cash provided by financing activities of $950,380 for the year ended December 31, 2010.
In 2011, the Company's financing activities consisted primarily of the repayment and repurchase of senior
notes and debentures pursuant to a tender offer of $1,227,307, treasury stock purchases of $555,831,
dividend payments to common stockholders of $162,032, deemed repurchase of restricted stock of
$35,555 and additions to deferred financing costs of $25,626, partially offset by proceeds of $1,000,000
from the issuance of senior notes, net proceeds of credit facility debt of $676,699, net proceeds from
collateralized indebtedness of $49,850 and other net cash receipts of $1,934.
Net cash provided by financing activities amounted to $950,380 for the year ended December 31, 2010
and consisted primarily of proceeds of $1,500,000 from the issuance of senior notes, net proceeds of
credit facility debt of $1,037,712, partially offset by the repurchase of senior notes and debentures
pursuant to a tender offer of $1,078,212, treasury stock purchases of $300,247, dividend payments to
common stockholders of $140,734, additions to deferred financing costs of $65,723 and other net cash
payments of $2,416.
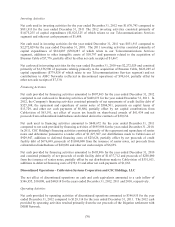
Continuing Operations - CSC Holdings, LLC
Operating Activities
Net cash provided by operating activities amounted to $1,305,334 for the year ended December 31, 2012
compared to $1,615,717 for the year ended December 31, 2011. The 2012 cash provided by operating
activities resulted from $1,265,058 of income before depreciation and amortization (including
impairments), $153,521 of non-cash items and $21,533 resulting from a decrease in current and other
assets and advances to affiliates. Partially offsetting these increases were decreases in cash of $79,395
from a decrease in accounts payable, other liabilities and amounts due to affiliates, and $55,383 resulting
from a decrease in liabilities under derivative contracts. The decrease in cash provided by operating
activities of $310,383 in 2012 as compared to 2011 resulted from a decrease in income from continuing
operations before depreciation and amortization and other non-cash items of $408,245, partially offset by
an increase of $97,862 resulting from changes in working capital, including the timing of payments and
collections of accounts receivable, among other items.
Net cash provided by operating activities amounted to $1,615,717 for the year ended December 31, 2011
compared to $1,608,007 for the year ended December 31, 2010. The 2011 cash provided by operating
activities resulted from $1,388,052 of income before depreciation and amortization (including
impairments), $438,772 of non-cash items and a $9,500 increase in deferred revenue. Partially offsetting
these increases were decreases in cash of $111,895 resulting from a decrease in liabilities under derivative
contracts, $53,599 resulting from an increase in current and other assets and advances to affiliates and
$55,113 from a decrease in accounts payable, other liabilities and amounts due to affiliates. The increase
in cash provided by operating activities of $7,710 in 2011 as compared to 2010 resulted from an increase
in income from continuing operations before depreciation and amortization and other non-cash items of
$190,378, partially offset by a decrease of $182,668 resulting from changes in working capital, including
the timing of payments and collections of accounts receivable, among other items.
Net cash provided by operating activities amounted to $1,608,007 for the year ended December 31, 2010.
The 2010 cash provided by operating activities resulted from $1,308,170 of income before depreciation
and amortization (including impairments), $328,276 of non-cash items and a $75,236 increase in accounts
payable, other liabilities and amounts due to affiliates. Partially offsetting these increases were decreases
in cash of $59,492 resulting from an increase in current and other assets and advances to affiliates and a
$44,183 decrease in liabilities under derivative contracts.