Cablevision 2012 Annual Report Download - page 103
Download and view the complete annual report
Please find page 103 of the 2012 Cablevision annual report below. You can navigate through the pages in the report by either clicking on the pages listed below, or by using the keyword search tool below to find specific information within the annual report.-
 1
1 -
2
-
3
-
4
-
5
-
6
-
7
-
8
-
9
-
10
-
11
-
12
-
13
-
14
-
15
-
16
-
17
-
18
-
19
-
20
-
21
-
22
-
23
-
24
-
25
-
26
-
27
-
28
-
29
-
30
-
31
-
32
-
33
-
34
-
35
-
36
-
37
-
38
-
39
-
40
-
41
-
42
-
43
-
44
-
45
-
46
-
47
-
48
-
49
-
50
-
51
-
52
-
53
-
54
-
55
-
56
-
57
-
58
-
59
-
60
-
61
-
62
-
63
-
64
-
65
-
66
-
67
-
68
-
69
-
70
-
71
-
72
-
73
-
74
-
75
-
76
-
77
-
78
-
79
-
80
-
81
-
82
-
83
-
84
-
85
-
86
-
87
-
88
-
89
-
90
-
91
-
92
-
 93
93 -
 94
94 -
 95
95 -
 96
96 -
 97
97 -
 98
98 -
 99
99 -
 100
100 -
 101
101 -
 102
102 -
 103
103 -
 104
104 -
 105
105 -
 106
106 -
 107
107 -
 108
108 -
 109
109 -
 110
110 -
 111
111 -
 112
112 -
 113
113 -
114
-
115
-
116
-
117
-
118
-
119
-
120
-
121
-
122
-
123
-
124
-
125
-
126
-
127
-
128
-
129
-
130
-
131
-
132
-
133
-
134
-
135
-
136
-
137
-
138
-
139
-
140
-
141
-
142
-
143
-
144
-
145
-
146
-
147
-
148
-
149
-
150
-
151
-
152
-
153
-
154
-
155
-
156
-
157
-
158
-
159
-
160
-
161
-
162
-
163
-
164
-
165
-
166
-
167
-
168
-
169
-
170
-
171
-
172
-
173
-
174
-
175
-
176
-
177
-
178
-
179
-
180
-
181
-
182
-
183
-
184
-
185
-
186
-
187
-
188
-
189
-
190
-
191
-
192
-
193
-
194
-
195
-
196
-
197
-
198
-
199
-
200
-
201
-
202
-
203
-
204
-
205
-
206
-
207
-
208
-
209
-
210
-
211
-
212
-
213
-
214
-
215
-
216
-
217
-
218
-
219
-
220
 |
 |

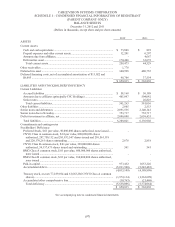
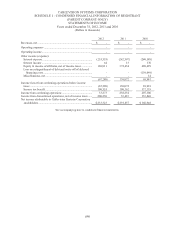
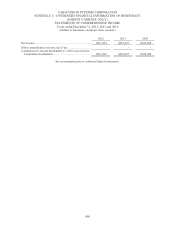
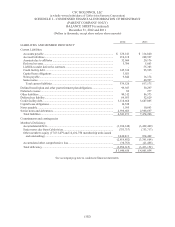
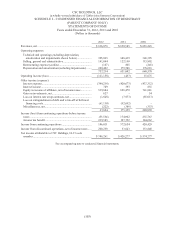
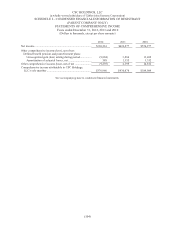
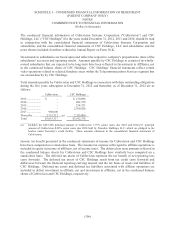
CABLEVISION SYSTEMS CORPORATION
SCHEDULE I – CONDENSED FINANCIAL INFORMATION OF REGISTRANT
(PARENT COMPANY ONLY)
BALANCE SHEETS
December 31, 2012 and 2011
(Dollars in thousands, except share and per share amounts)
(97)
2012 2011
ASSETS
Current Assets:
Cash and cash equivalents ................................................................................... $ 75,866 $ 893
Prepaid expenses and other current assets ........................................................... 12,201 6,297
Amounts due from affiliates................................................................................ - 4,667
Deferred tax asset ................................................................................................ 170,406 32,672
Total current assets .......................................................................................... 258,473 44,529
Other receivables .................................................................................................... 1,778 -
Deferred tax asset ................................................................................................... 340,998 480,755
Deferred financing costs, net of accumulated amortization of $13,022 and
$8,605 ................................................................................................................. 48,766 37,554
$ 650,015 $ 562,838
LIABILITIES AND STOCKHOLDERS' DEFICIENCY
Current Liabilities:
Accrued liabilities ............................................................................................... $ 58,168 $ 50,189
Amounts due to affiliates (principally CSC Holdings) ....................................... 485,097 504,042
Senior notes ........................................................................................................ - 26,825
Total current liabilities ..................................................................................... 543,265 581,056
Other liabilities ....................................................................................................... 2,605 2,553
Senior notes and debentures .................................................................................. 2,891,536 2,140,141
Senior notes due to Newsday .................................................................................. 753,717 753,717
Deficit investment in affiliate, net .......................................................................... 2,096,898 2,659,435
Total liabilities .................................................................................................... 6,288,021 6,136,902
Commitments and contingencies
Stockholders' Deficiency:
Preferred Stock, $.01 par value, 50,000,000 shares authorized, none issued ...... - -
CNYG Class A common stock, $.01 par value, 800,000,000 shares
authorized, 287,750,132 and 281,833,547 shares issued and 210,561,118
and 220,170,261 shares outstanding ................................................................ 2,878 2,818
CNYG Class B common stock, $.01 par value, 320,000,000 shares
authorized, 54,137,673 shares issued and outstanding .................................... 541 541
RMG Class A common stock, $.01 par value, 600,000,000 shares authorized,
none issued ...................................................................................................... - -
RMG Class B common stock, $.01 par value, 160,000,000 shares authorized,
none issued ...................................................................................................... - -
Paid-in capital ..................................................................................................... 973,432 1,053,226
Accumulated deficit ............................................................................................ (5,011,960) (5,245,483)
(4,035,109) (4,188,898)
Treasury stock, at cost (77,189,014 and 61,663,286 CNYG Class A common
shares) .............................................................................................................. (1,572,134) (1,363,698)
Accumulated other comprehensive loss .............................................................. (30,763) (21,468)
Total deficiency ............................................................................................... (5,638,006) (5,574,064)
$ 650,015 $ 562,838
See accompanying note to condensed financial statements.