Cablevision 2012 Annual Report Download - page 178
Download and view the complete annual report
Please find page 178 of the 2012 Cablevision annual report below. You can navigate through the pages in the report by either clicking on the pages listed below, or by using the keyword search tool below to find specific information within the annual report.-
 1
1 -
2
-
3
-
4
-
5
-
6
-
7
-
8
-
9
-
10
-
11
-
12
-
13
-
14
-
15
-
16
-
17
-
18
-
19
-
20
-
21
-
22
-
23
-
24
-
25
-
26
-
27
-
28
-
29
-
30
-
31
-
32
-
33
-
34
-
35
-
36
-
37
-
38
-
39
-
40
-
41
-
42
-
43
-
44
-
45
-
46
-
47
-
48
-
49
-
50
-
51
-
52
-
53
-
54
-
55
-
56
-
57
-
58
-
59
-
60
-
61
-
62
-
63
-
64
-
65
-
66
-
67
-
68
-
69
-
70
-
71
-
72
-
73
-
74
-
75
-
76
-
77
-
78
-
79
-
80
-
81
-
82
-
83
-
84
-
85
-
86
-
87
-
88
-
89
-
90
-
91
-
92
-
93
-
94
-
95
-
96
-
97
-
98
-
99
-
100
-
101
-
102
-
103
-
104
-
105
-
106
-
107
-
108
-
109
-
110
-
111
-
112
-
113
-
114
-
115
-
116
-
117
-
118
-
119
-
120
-
121
-
122
-
123
-
124
-
125
-
126
-
127
-
128
-
129
-
130
-
131
-
132
-
133
-
134
-
135
-
136
-
137
-
138
-
139
-
140
-
141
-
142
-
143
-
144
-
145
-
146
-
147
-
148
-
149
-
150
-
151
-
152
-
153
-
154
-
155
-
156
-
157
-
158
-
159
-
160
-
161
-
162
-
163
-
164
-
165
-
166
-
167
-
 168
168 -
 169
169 -
 170
170 -
 171
171 -
 172
172 -
 173
173 -
 174
174 -
 175
175 -
 176
176 -
 177
177 -
 178
178 -
 179
179 -
 180
180 -
 181
181 -
 182
182 -
 183
183 -
 184
184 -
 185
185 -
 186
186 -
 187
187 -
 188
188 -
189
-
190
-
191
-
192
-
193
-
194
-
195
-
196
-
197
-
198
-
199
-
200
-
201
-
202
-
203
-
204
-
205
-
206
-
207
-
208
-
209
-
210
-
211
-
212
-
213
-
214
-
215
-
216
-
217
-
218
-
219
-
220
 |
 |

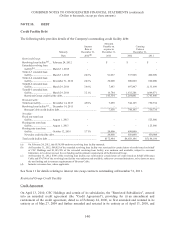
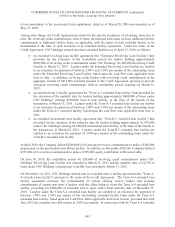
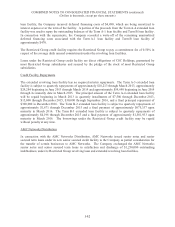
COMBINED NOTES TO CONSOLIDATED FINANCIAL STATEMENTS (continued)
(Dollars in thousands, except per share amounts)
I-50
consolidated balance sheets as an asset or liability and the net increases or decreases in the fair value of
the equity derivative component of the prepaid forward contracts are included in gain (loss) on derivative
contracts in the accompanying consolidated statements of income.
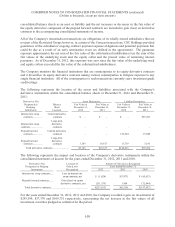
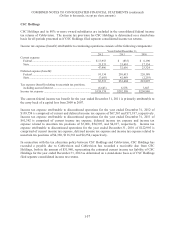
All of the Company's monetization transactions are obligations of its wholly-owned subsidiaries that are
not part of the Restricted Group; however, in certain of the Comcast transactions, CSC Holdings provided
guarantees of the subsidiaries' ongoing contract payment expense obligations and potential payments that
could be due as a result of an early termination event (as defined in the agreements). The guarantee
exposure approximates the net sum of the fair value of the collateralized indebtedness less the sum of the
fair values of the underlying stock and the equity collar and the present value of remaining interest
payments. As of December 31, 2012, this exposure was zero since the fair value of the underlying stock
and equity collars exceeded the fair value of the collateralized indebtedness.
The Company monitors the financial institutions that are counterparties to its equity derivative contracts
and it diversifies its equity derivative contracts among various counterparties to mitigate exposure to any
single financial institution. All of the counterparties to such transactions currently carry investment grade
credit ratings.
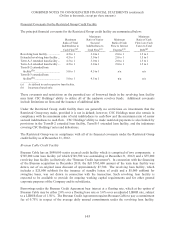
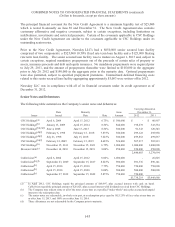
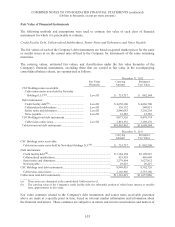
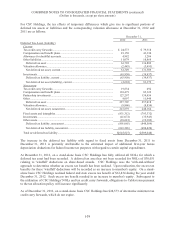
The following represents the location of the assets and liabilities associated with the Company's
derivative instruments within the consolidated balance sheets at December 31, 2012 and December 31,
2011:
Derivatives Not Asset Derivatives Liability Derivatives
Designated as
Hedging
Instruments
Balance
Sheet
Location
Fair Value at
December 31,
2012
Fair Value at
December 31,
2011
Fair Value at
December 31,
2012
Fair Value at
December 31,
2011
Interest rate swap
contracts .............
.
Current derivative
contracts $ - $ - $ - $55,383
Interest rate swap
contracts .................
.
Long-term
derivative
contracts - - - -
Prepaid forward
contracts .............
.
Current derivative
contracts - - 134,524 19,840
Prepaid forward
contracts .............
.
Long-term
derivative
contracts 3,143 18,617 13,739 3,141
Total derivative contracts ........................
.
$3,143 $18,617 $148,263 $78,364
The following represents the impact and location of the Company's derivative instruments within the
consolidated statements of income for the years ended December 31, 2012, 2011 and 2010:
Derivatives Not Location of Amount of Gain (Loss) Recognized
Designated as Hedging Gain (Loss) Years Ended December 31,
Instruments Recognized 2012 2011 2010
Interest rate swap contracts ....
.
Loss on interest rate
swap contracts, net $ (1,828) $(7,973) $ (85,013)
Prepaid forward contracts ......
.
Gain (loss) on equity
derivative contracts, net (211,335) 1,454 (72,044)
Total derivative contracts ........................................................ $(213,163) $(6,519) $(157,057)
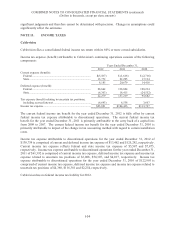
For the years ended December 31, 2012, 2011 and 2010, the Company recorded a gain on investments of
$293,599, $37,370 and $109,751 respectively, representing the net increase in the fair values of all
investment securities pledged as collateral for the period.