Cablevision 2012 Annual Report Download - page 111
Download and view the complete annual report
Please find page 111 of the 2012 Cablevision annual report below. You can navigate through the pages in the report by either clicking on the pages listed below, or by using the keyword search tool below to find specific information within the annual report.-
 1
1 -
2
-
3
-
4
-
5
-
6
-
7
-
8
-
9
-
10
-
11
-
12
-
13
-
14
-
15
-
16
-
17
-
18
-
19
-
20
-
21
-
22
-
23
-
24
-
25
-
26
-
27
-
28
-
29
-
30
-
31
-
32
-
33
-
34
-
35
-
36
-
37
-
38
-
39
-
40
-
41
-
42
-
43
-
44
-
45
-
46
-
47
-
48
-
49
-
50
-
51
-
52
-
53
-
54
-
55
-
56
-
57
-
58
-
59
-
60
-
61
-
62
-
63
-
64
-
65
-
66
-
67
-
68
-
69
-
70
-
71
-
72
-
73
-
74
-
75
-
76
-
77
-
78
-
79
-
80
-
81
-
82
-
83
-
84
-
85
-
86
-
87
-
88
-
89
-
90
-
91
-
92
-
93
-
94
-
95
-
96
-
97
-
98
-
99
-
100
-
 101
101 -
 102
102 -
 103
103 -
 104
104 -
 105
105 -
 106
106 -
 107
107 -
 108
108 -
 109
109 -
 110
110 -
 111
111 -
 112
112 -
 113
113 -
 114
114 -
 115
115 -
 116
116 -
 117
117 -
 118
118 -
 119
119 -
 120
120 -
 121
121 -
122
-
123
-
124
-
125
-
126
-
127
-
128
-
129
-
130
-
131
-
132
-
133
-
134
-
135
-
136
-
137
-
138
-
139
-
140
-
141
-
142
-
143
-
144
-
145
-
146
-
147
-
148
-
149
-
150
-
151
-
152
-
153
-
154
-
155
-
156
-
157
-
158
-
159
-
160
-
161
-
162
-
163
-
164
-
165
-
166
-
167
-
168
-
169
-
170
-
171
-
172
-
173
-
174
-
175
-
176
-
177
-
178
-
179
-
180
-
181
-
182
-
183
-
184
-
185
-
186
-
187
-
188
-
189
-
190
-
191
-
192
-
193
-
194
-
195
-
196
-
197
-
198
-
199
-
200
-
201
-
202
-
203
-
204
-
205
-
206
-
207
-
208
-
209
-
210
-
211
-
212
-
213
-
214
-
215
-
216
-
217
-
218
-
219
-
220
 |
 |

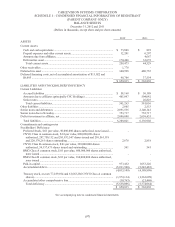
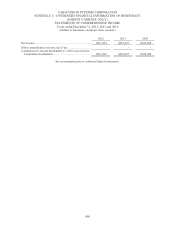
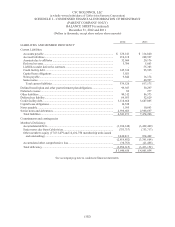
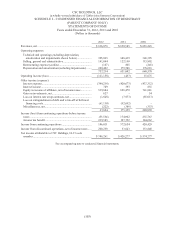
CSC HOLDINGS, LLC
(a wholly-owned subsidiary of Cablevision Systems Corporation)
SCHEDULE I – CONDENSED FINANCIAL INFORMATION OF REGISTRANT
(PARENT COMPANY ONLY)
STATEMENTS OF CASH FLOWS
Years ended December 31, 2012, 2011 and 2010
(Dollars in thousands)
(105)
2012 2011 2010
Cash flows from operating activities:
Income from continuing operations ...........................................
.
$ 186,011 $ 372,654 $ 420,429
Adjustments to reconcile income from continuing operations
to net cash used in operating activities:
Depreciation and amortization (including impairments) ........
.
220,492 179,588 178,618
Equity in income of affiliates, net of income taxes ................
.
(519,644) (696,470) (741,881)
Loss (gain) on investments, net..............................................
.
(627) - (54)
Loss on extinguishment of debt and write-off of deferred
financing costs ...................................................................
.
61,130 92,692 -
Amortization of deferred financing costs, discounts on
indebtedness and other costs ..............................................
.
24,824 31,637 30,308
Share-based compensation expense related to equity
classified awards ................................................................
.
3,259 2,207 2,262
Deferred income taxes ...........................................................
.
(232,902) (203,880) (188,329)
Provision for doubtful accounts .............................................
.
3,497 3,770 4,555
Amounts due to/from Cablevision .........................................
.
34,558 (6,742) 5,332
Amounts due to/from other affiliates .....................................
.
(4,050) (55,072) 15,585
Change in assets and liabilities ..................................................
.
(57,499) (161,893) (32,302)
Net cash used in operating activities ..........................................
.
(280,951) (441,509) (305,477)
Cash flows from investing activities:
Capital expenditures ..................................................................
.
(311,838) (196,447) (157,728)
Proceeds from sale of equipment, net of costs of disposal ........
.
(1,311) 703 648
Distributions from affiliates .......................................................
.
923,327 1,478,061 787,689
Decrease in other investments ...................................................
.
955 50 133
Additions to other intangible assets ...........................................
.
(1,140) (914) (257)
Net cash provided by investing activities ...............................
.
609,993 1,281,453 630,485
Cash flows from financing activities:
Proceeds from credit facility debt ..............................................
.
- 1,265,000 795,000
Repayment of credit facility debt ...............................................
.
(519,458) (580,651) (514,638)
Proceeds from issuance of senior notes .....................................
.
- 1,000,000 -
Repayment and repurchase of senior notes and debentures,
including tender premiums and fees ......................................
.
(504,501) (1,227,307) -
Principal payments on capital lease obligations ........................
.
(1,608) - -
Capital contributions from Cablevision .....................................
.
735,000 - 5,259
Distributions to Cablevision ......................................................
.
(671,809) (929,947) (556,272)
Additions to deferred financing costs ........................................
.
(738) (25,186) (13,036)
Net cash used in financing activities ......................................
.
(963,114) (498,091) (283,687)
Net increase (decrease) in cash and cash equivalents from
continuing operations ................................................................
.
(634,072) 341,853 41,321
Cash flows of discontinued operations:
Net cash provided by operating activities ..................................
.
346,955 - -
Net increase in cash and cash equivalents from discontinued
operations ..................................................................................
.
346,955 - -
Cash and cash equivalents at beginning of year ............................
.
459,574 117,721 76,400
Cash and cash equivalents at end of year ......................................
.
$ 172,457 $ 459,574 $ 117,721
See accompanying note to condensed financial statements.