Cablevision 2012 Annual Report Download - page 73
Download and view the complete annual report
Please find page 73 of the 2012 Cablevision annual report below. You can navigate through the pages in the report by either clicking on the pages listed below, or by using the keyword search tool below to find specific information within the annual report.-
 1
1 -
2
-
3
-
4
-
5
-
6
-
7
-
8
-
9
-
10
-
11
-
12
-
13
-
14
-
15
-
16
-
17
-
18
-
19
-
20
-
21
-
22
-
23
-
24
-
25
-
26
-
27
-
28
-
29
-
30
-
31
-
32
-
33
-
34
-
35
-
36
-
37
-
38
-
39
-
40
-
41
-
42
-
43
-
44
-
45
-
46
-
47
-
48
-
49
-
50
-
51
-
52
-
53
-
54
-
55
-
56
-
57
-
58
-
59
-
60
-
61
-
62
-
 63
63 -
 64
64 -
 65
65 -
 66
66 -
 67
67 -
 68
68 -
 69
69 -
 70
70 -
 71
71 -
 72
72 -
 73
73 -
 74
74 -
 75
75 -
 76
76 -
 77
77 -
 78
78 -
 79
79 -
 80
80 -
 81
81 -
 82
82 -
 83
83 -
84
-
85
-
86
-
87
-
88
-
89
-
90
-
91
-
92
-
93
-
94
-
95
-
96
-
97
-
98
-
99
-
100
-
101
-
102
-
103
-
104
-
105
-
106
-
107
-
108
-
109
-
110
-
111
-
112
-
113
-
114
-
115
-
116
-
117
-
118
-
119
-
120
-
121
-
122
-
123
-
124
-
125
-
126
-
127
-
128
-
129
-
130
-
131
-
132
-
133
-
134
-
135
-
136
-
137
-
138
-
139
-
140
-
141
-
142
-
143
-
144
-
145
-
146
-
147
-
148
-
149
-
150
-
151
-
152
-
153
-
154
-
155
-
156
-
157
-
158
-
159
-
160
-
161
-
162
-
163
-
164
-
165
-
166
-
167
-
168
-
169
-
170
-
171
-
172
-
173
-
174
-
175
-
176
-
177
-
178
-
179
-
180
-
181
-
182
-
183
-
184
-
185
-
186
-
187
-
188
-
189
-
190
-
191
-
192
-
193
-
194
-
195
-
196
-
197
-
198
-
199
-
200
-
201
-
202
-
203
-
204
-
205
-
206
-
207
-
208
-
209
-
210
-
211
-
212
-
213
-
214
-
215
-
216
-
217
-
218
-
219
-
220
 |
 |

(67)
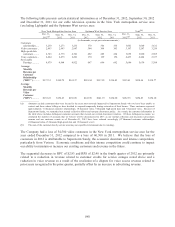
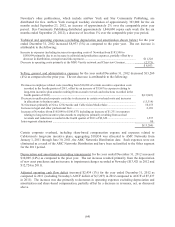
The Company recorded income tax expense of $113,767 for the year ended December 31, 2010,
reflecting an effective tax rate of 35%. In the second quarter of 2010, the Company recorded a
nonrecurring tax benefit of $18,951 for an increase in certain state and city net operating loss carry
forwards pursuant to the finalization of an examination with a state taxing authority. Absent this tax
benefit, the effective tax rate for the year ended December 31, 2010 would have been 41%. The
Company recorded tax expense of $5,842 for the impact of a change in the state rate used to measure
deferred taxes principally due to the impact of the MSG Distribution on February 9, 2010. A decrease in
the valuation allowance relating to certain state net operating loss carry forwards resulted in a tax benefit
of $2,428. The Company recorded tax expense of $1,202 related to uncertain tax positions.
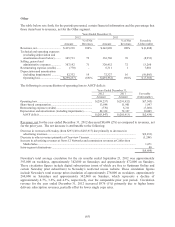
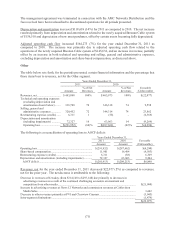
Income from discontinued operations
Income from discontinued operations, net of income taxes, for the years ended December 31, 2011 and
2010 reflects the following items:
Years Ended December 31,
2011 2010
Net operating results of AMC Networks, including transaction costs, net of
income taxes(a) ..................................................................................................... $53,623 $157,970
Net operating results of Madison Square Garden, including transaction costs,
net of income taxes(b) ........................................................................................... - (4,122)
$53,623 $153,848
________________
(a) Includes operating results of AMC Networks through the date of the AMC Networks Distribution.
(b) Includes operating results of the Madison Square Garden segment from January 1, 2010 through the date of the
MSG Distribution.
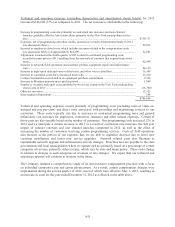
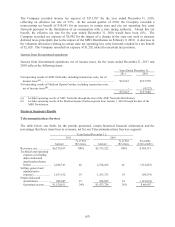
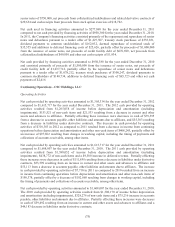
Business Segments Results
Telecommunications Services
The table below sets forth, for the periods presented, certain historical financial information and the
percentage that those items bear to revenues, net for our Telecommunications Services segment:
Years Ended December 31,
2011 2010
Amount
% of Net
Revenues Amount
% of Net
Revenues
Favorable
(Unfavorable)
Revenues, net ..................
.
$6,279,653 100% $5,735,522 100% $ 544,131
Technical and operating
expenses (excluding
depreciation and
amortization shown
below) .........................
.
2,648,743 42 2,334,456 41 (314,287)
Selling, general and
administrative
expenses ......................
.
1,167,632 19 1,103,313 19 (64,319)
Depreciation and
amortization ................
.
942,647 15 824,029 14 (118,618)
Operating income ........
.
$1,520,631 24% $1,473,724 26% $ 46,907