Cablevision 2012 Annual Report Download - page 165
Download and view the complete annual report
Please find page 165 of the 2012 Cablevision annual report below. You can navigate through the pages in the report by either clicking on the pages listed below, or by using the keyword search tool below to find specific information within the annual report.-
 1
1 -
2
-
3
-
4
-
5
-
6
-
7
-
8
-
9
-
10
-
11
-
12
-
13
-
14
-
15
-
16
-
17
-
18
-
19
-
20
-
21
-
22
-
23
-
24
-
25
-
26
-
27
-
28
-
29
-
30
-
31
-
32
-
33
-
34
-
35
-
36
-
37
-
38
-
39
-
40
-
41
-
42
-
43
-
44
-
45
-
46
-
47
-
48
-
49
-
50
-
51
-
52
-
53
-
54
-
55
-
56
-
57
-
58
-
59
-
60
-
61
-
62
-
63
-
64
-
65
-
66
-
67
-
68
-
69
-
70
-
71
-
72
-
73
-
74
-
75
-
76
-
77
-
78
-
79
-
80
-
81
-
82
-
83
-
84
-
85
-
86
-
87
-
88
-
89
-
90
-
91
-
92
-
93
-
94
-
95
-
96
-
97
-
98
-
99
-
100
-
101
-
102
-
103
-
104
-
105
-
106
-
107
-
108
-
109
-
110
-
111
-
112
-
113
-
114
-
115
-
116
-
117
-
118
-
119
-
120
-
121
-
122
-
123
-
124
-
125
-
126
-
127
-
128
-
129
-
130
-
131
-
132
-
133
-
134
-
135
-
136
-
137
-
138
-
139
-
140
-
141
-
142
-
143
-
144
-
145
-
146
-
147
-
148
-
149
-
150
-
151
-
152
-
153
-
154
-
 155
155 -
 156
156 -
 157
157 -
 158
158 -
 159
159 -
 160
160 -
 161
161 -
 162
162 -
 163
163 -
 164
164 -
 165
165 -
 166
166 -
 167
167 -
 168
168 -
 169
169 -
 170
170 -
 171
171 -
 172
172 -
 173
173 -
 174
174 -
 175
175 -
176
-
177
-
178
-
179
-
180
-
181
-
182
-
183
-
184
-
185
-
186
-
187
-
188
-
189
-
190
-
191
-
192
-
193
-
194
-
195
-
196
-
197
-
198
-
199
-
200
-
201
-
202
-
203
-
204
-
205
-
206
-
207
-
208
-
209
-
210
-
211
-
212
-
213
-
214
-
215
-
216
-
217
-
218
-
219
-
220
 |
 |

COMBINED NOTES TO CONSOLIDATED FINANCIAL STATEMENTS (continued)
(Dollars in thousands, except per share amounts)
I-37
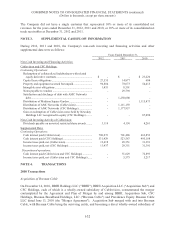
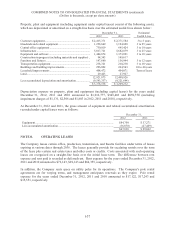
Property, plant and equipment (including equipment under capital leases) consist of the following assets,
which are depreciated or amortized on a straight-line basis over the estimated useful lives shown below:
December 31, Estimated
2012 2011 Useful Lives
Customer equipment ..............................................................
.
$ 2,415,371 $ 2,371,584 3 to 5 years
Headends and related equipment ...........................................
.
1,258,649 1,194,608 3 to 25 years
Central office equipment .......................................................
.
730,019 695,424 3 to 10 years
Infrastructure .........................................................................
.
5,817,721 5,682,079 3 to 25 years
Equipment and software ........................................................
.
1,484,874 1,373,891 3 to 10 years
Construction in progress (including materials and supplies) .
.
94,343 109,617
Furniture and fixtures ............................................................
.
147,880 156,944 3 to 12 years
Transportation equipment ......................................................
.
238,321 210,238 3 to 18 years
Buildings and building improvements ...................................
.
296,802 264,543 10 to 40 years
Leasehold improvements .......................................................
.
408,472 404,071 Term of lease
Land .......................................................................................
.
29,423 27,927
12,921,875 12,490,926
Less accumulated depreciation and amortization ..................
.
(9,543,337) (9,221,694)
$ 3,378,538 $ 3,269,232
Depreciation expense on property, plant and equipment (including capital leases) for the years ended
December 31, 2012, 2011 and 2010 amounted to $1,012,777, $945,403 and $859,750 (including
impairment charges of $1,131, $2,506 and $1,803 in 2012, 2011 and 2010), respectively.
At December 31, 2012 and 2011, the gross amount of equipment and related accumulated amortization
recorded under capital leases were as follows:
December 31,
2012 2011
Equipment ............................................................................................................. $84,700 $ 57,271
Less accumulated amortization ............................................................................. (36,870) (27,409)
$47,830 $ 29,862
NOTE 8. OPERATING LEASES
The Company leases certain office, production, transmission, and theatre facilities under terms of leases
expiring at various dates through 2036. The leases generally provide for escalating rentals over the term
of the lease plus certain real estate taxes and other costs or credits. Costs associated with such operating
leases are recognized on a straight-line basis over the initial lease term. The difference between rent
expense and rent paid is recorded as deferred rent. Rent expense for the years ended December 31, 2012,
2011 and 2010 amounted to $72,143, $69,143 and $64,355, respectively.
In addition, the Company rents space on utility poles for its operations. The Company's pole rental
agreements are for varying terms, and management anticipates renewals as they expire. Pole rental
expense for the years ended December 31, 2012, 2011 and 2010 amounted to $17,122, $17,243 and
$15,551, respectively.