Cablevision 2012 Annual Report Download - page 71
Download and view the complete annual report
Please find page 71 of the 2012 Cablevision annual report below. You can navigate through the pages in the report by either clicking on the pages listed below, or by using the keyword search tool below to find specific information within the annual report.-
 1
1 -
2
-
3
-
4
-
5
-
6
-
7
-
8
-
9
-
10
-
11
-
12
-
13
-
14
-
15
-
16
-
17
-
18
-
19
-
20
-
21
-
22
-
23
-
24
-
25
-
26
-
27
-
28
-
29
-
30
-
31
-
32
-
33
-
34
-
35
-
36
-
37
-
38
-
39
-
40
-
41
-
42
-
43
-
44
-
45
-
46
-
47
-
48
-
49
-
50
-
51
-
52
-
53
-
54
-
55
-
56
-
57
-
58
-
59
-
60
-
 61
61 -
 62
62 -
 63
63 -
 64
64 -
 65
65 -
 66
66 -
 67
67 -
 68
68 -
 69
69 -
 70
70 -
 71
71 -
 72
72 -
 73
73 -
 74
74 -
 75
75 -
 76
76 -
 77
77 -
 78
78 -
 79
79 -
 80
80 -
 81
81 -
82
-
83
-
84
-
85
-
86
-
87
-
88
-
89
-
90
-
91
-
92
-
93
-
94
-
95
-
96
-
97
-
98
-
99
-
100
-
101
-
102
-
103
-
104
-
105
-
106
-
107
-
108
-
109
-
110
-
111
-
112
-
113
-
114
-
115
-
116
-
117
-
118
-
119
-
120
-
121
-
122
-
123
-
124
-
125
-
126
-
127
-
128
-
129
-
130
-
131
-
132
-
133
-
134
-
135
-
136
-
137
-
138
-
139
-
140
-
141
-
142
-
143
-
144
-
145
-
146
-
147
-
148
-
149
-
150
-
151
-
152
-
153
-
154
-
155
-
156
-
157
-
158
-
159
-
160
-
161
-
162
-
163
-
164
-
165
-
166
-
167
-
168
-
169
-
170
-
171
-
172
-
173
-
174
-
175
-
176
-
177
-
178
-
179
-
180
-
181
-
182
-
183
-
184
-
185
-
186
-
187
-
188
-
189
-
190
-
191
-
192
-
193
-
194
-
195
-
196
-
197
-
198
-
199
-
200
-
201
-
202
-
203
-
204
-
205
-
206
-
207
-
208
-
209
-
210
-
211
-
212
-
213
-
214
-
215
-
216
-
217
-
218
-
219
-
220
 |
 |

(65)
Comparison of Consolidated Year Ended December 31, 2011 Versus Year Ended December 31,
2010
Consolidated Results - Cablevision Systems Corporation
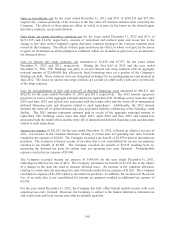
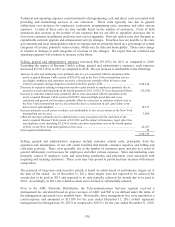
Revenues, net for the year ended December 31, 2011 increased $523,273 (8%) as compared to revenues,
net for the prior year. The net increase is attributable to the following:
Increase in revenues of the Telecommunications Services segment ..................................................... $544,131
Decrease in revenues of the Other segment ........................................................................................... (22,077)
Inter-segment eliminations .................................................................................................................... 1,219
$523,273
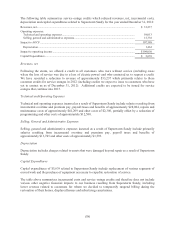
Technical and operating expenses (excluding depreciation, amortization and impairments) include
primarily:
xcable programming costs which are costs paid to programmers, net of amortization of any
launch support received, for cable content and are generally paid on a per-subscriber basis;
xnetwork management and field service costs which represent costs associated with the
maintenance of our broadband network, including costs of certain customer connections;
xinterconnection, call completion and circuit fees relating to our telephone and VoIP businesses
which represent the transport and termination of calls with other telecommunications carriers;
and
xpublication production and distribution costs of our Newsday business.
Technical and operating expenses (excluding depreciation, amortization and impairments) in 2011
increased $304,792 (11%) as compared to 2010. The net increase is attributable to the following:
Increase in expenses of the Telecommunications Services segment ..................................................... $314,287
Decrease in expenses of the Other segment ........................................................................................... (9,558)
Inter-segment eliminations .................................................................................................................... 63
$304,792
As a percentage of revenues, technical and operating expenses increased 1% in 2011 as compared to
2010.
Selling, general and administrative expenses include primarily sales, marketing and advertising expenses,
administrative costs, and costs of customer call centers. Selling, general and administrative expenses
increased $41,613 (3%) for 2011 as compared to 2010. The net increase is attributable to the following:
Increase in expenses of the Telecommunications Services segment .................................................... $ 64,319
Decrease in expenses of the Other segment .......................................................................................... (23,862)
Inter-segment eliminations ................................................................................................................... 1,156
$ 41,613
As a percentage of revenues, selling, general and administrative expenses decreased 1% in 2011 as
compared to 2010.
Depreciation and amortization (including impairments) increased $127,882 (14%) for 2011 as compared
to 2010. The net increase is attributable to the following:
Increase in expenses of the Telecommunications Services segment .................................................... $118,618
Increase in expenses of the Other segment ........................................................................................... 9,264
$127,882