Cablevision 2012 Annual Report Download - page 65
Download and view the complete annual report
Please find page 65 of the 2012 Cablevision annual report below. You can navigate through the pages in the report by either clicking on the pages listed below, or by using the keyword search tool below to find specific information within the annual report.-
 1
1 -
2
-
3
-
4
-
5
-
6
-
7
-
8
-
9
-
10
-
11
-
12
-
13
-
14
-
15
-
16
-
17
-
18
-
19
-
20
-
21
-
22
-
23
-
24
-
25
-
26
-
27
-
28
-
29
-
30
-
31
-
32
-
33
-
34
-
35
-
36
-
37
-
38
-
39
-
40
-
41
-
42
-
43
-
44
-
45
-
46
-
47
-
48
-
49
-
50
-
51
-
52
-
53
-
54
-
 55
55 -
 56
56 -
 57
57 -
 58
58 -
 59
59 -
 60
60 -
 61
61 -
 62
62 -
 63
63 -
 64
64 -
 65
65 -
 66
66 -
 67
67 -
 68
68 -
 69
69 -
 70
70 -
 71
71 -
 72
72 -
 73
73 -
 74
74 -
 75
75 -
76
-
77
-
78
-
79
-
80
-
81
-
82
-
83
-
84
-
85
-
86
-
87
-
88
-
89
-
90
-
91
-
92
-
93
-
94
-
95
-
96
-
97
-
98
-
99
-
100
-
101
-
102
-
103
-
104
-
105
-
106
-
107
-
108
-
109
-
110
-
111
-
112
-
113
-
114
-
115
-
116
-
117
-
118
-
119
-
120
-
121
-
122
-
123
-
124
-
125
-
126
-
127
-
128
-
129
-
130
-
131
-
132
-
133
-
134
-
135
-
136
-
137
-
138
-
139
-
140
-
141
-
142
-
143
-
144
-
145
-
146
-
147
-
148
-
149
-
150
-
151
-
152
-
153
-
154
-
155
-
156
-
157
-
158
-
159
-
160
-
161
-
162
-
163
-
164
-
165
-
166
-
167
-
168
-
169
-
170
-
171
-
172
-
173
-
174
-
175
-
176
-
177
-
178
-
179
-
180
-
181
-
182
-
183
-
184
-
185
-
186
-
187
-
188
-
189
-
190
-
191
-
192
-
193
-
194
-
195
-
196
-
197
-
198
-
199
-
200
-
201
-
202
-
203
-
204
-
205
-
206
-
207
-
208
-
209
-
210
-
211
-
212
-
213
-
214
-
215
-
216
-
217
-
218
-
219
-
220
 |
 |

(59)
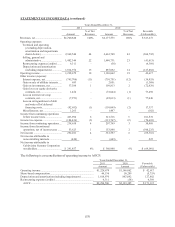
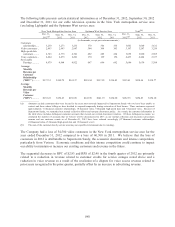
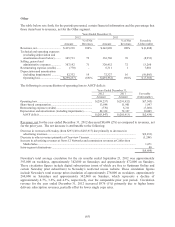
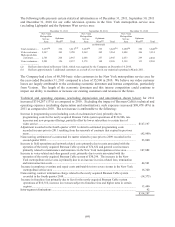
Revenues, net for the year ended December 31, 2012 increased $12,541 as compared to revenues, net for
the prior year. The net increase is attributable to the following:
Years Ended
December 31, Increase
Percent
Increase
2012 2011 (Decrease) (Decrease)
Video (including equipment rental, DVR,
video-on-demand, and pay-per-view) .......... $3,443,267 $3,521,882 $(78,615) (2)%
High-speed data ............................................. 1,366,117 1,329,354 36,763 3
Voice ............................................................. 906,167 885,343 20,824 2
Advertising .................................................... 167,056 150,671 16,385 11
Other (including installation, home
shopping, advertising sales commissions,
and other products) ...................................... 105,213 100,953 4,260 4
Total Cable Television ................................... 5,987,820 5,988,203 (383) -
Lightpath........................................................ 323,776 310,976 12,800 4
Intra-segment eliminations ............................ (19,402) (19,526) 124 1
Total Telecommunications Services ............ $6,292,194 $6,279,653 $ 12,541 -
The net revenue decrease in Cable Television was primarily derived from declines in video revenue in our
New York metropolitan service area of $94,497 for the year ended December 31, 2012, due to a 54,500
decline in video customers as compared to December 31, 2011, and lower average recurring video
revenue per video customer. In addition, Cable Television net revenues decreased as a result of
Superstorm Sandy (see discussion above). The decrease was substantially offset by increases in the
number of customers to our high-speed data and voice services, as set forth in the customer table below,
and increases in video revenues in our Optimum West service area, advertising and other revenue. In
addition, for the year ended December 31, 2012, net revenue includes the resolution of a voice access
dispute related to prior years of $12,902, of which $12,632 was recognized by Cable Television.
The increase in advertising net revenue is primarily attributable to higher advertising placements by
television and cable broadcast networks and higher political and automotive advertising in 2012. The
increase in Lightpath net revenues is primarily attributable to growth in Ethernet data services, partially
offset by reduced traditional data services.