Berkshire Hathaway 2015 Annual Report Download - page 92
Download and view the complete annual report
Please find page 92 of the 2015 Berkshire Hathaway annual report below. You can navigate through the pages in the report by either clicking on the pages listed below, or by using the keyword search tool below to find specific information within the annual report.-
 1
1 -
2
-
3
-
4
-
5
-
6
-
7
-
8
-
9
-
10
-
11
-
12
-
13
-
14
-
15
-
16
-
17
-
18
-
19
-
20
-
21
-
22
-
23
-
24
-
25
-
26
-
27
-
28
-
29
-
30
-
31
-
32
-
33
-
34
-
35
-
36
-
37
-
38
-
39
-
40
-
41
-
42
-
43
-
44
-
45
-
46
-
47
-
48
-
49
-
50
-
51
-
52
-
53
-
54
-
55
-
56
-
57
-
58
-
59
-
60
-
61
-
62
-
63
-
64
-
65
-
66
-
67
-
68
-
69
-
70
-
71
-
72
-
73
-
74
-
75
-
76
-
77
-
78
-
79
-
80
-
81
-
 82
82 -
 83
83 -
 84
84 -
 85
85 -
 86
86 -
 87
87 -
 88
88 -
 89
89 -
 90
90 -
 91
91 -
 92
92 -
 93
93 -
 94
94 -
 95
95 -
 96
96 -
 97
97 -
 98
98 -
 99
99 -
 100
100 -
 101
101 -
 102
102 -
103
-
104
-
105
-
106
-
107
-
108
-
109
-
110
-
111
-
112
-
113
-
114
-
115
-
116
-
117
-
118
-
119
-
120
-
121
-
122
-
123
-
124
 |
 |
Management’s Discussion and Analysis (Continued)
Manufacturing, Service and Retailing (Continued)
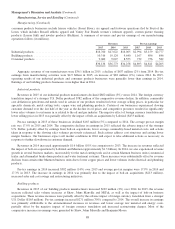
Service (Continued)
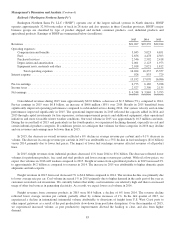
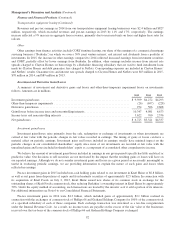
Pre-tax earnings in 2015 declined $46 million compared to 2014. Earnings in 2015 were favorably impacted by the WPLG
and Charter Brokerage acquisitions, which were more than offset by lower earnings from NetJets. Earnings declined at NetJets
as the impact of increased aircraft sales margins was more than offset by increased personnel, aircraft subcontracting and
maintenance expenses. A portion of the increase in personnel costs pertained to lump-sum payments made in connection with a
collective bargaining agreement reached with our pilots in the fourth quarter.
Revenues in 2014 increased $858 million (9.5%) over 2013. The increase was primarily attributable to comparative
increases generated by NetJets, FlightSafety and TTI. The revenue increase at NetJets reflected increased flight hours as well as
increased fractional aircraft sales. The revenue increase at TTI was driven by higher unit volume and, to a lesser extent, by bolt-
on acquisitions. The revenue increase at FlightSafety was primarily due to increased simulator training hours.
Pre-tax earnings in 2014 increased $109 million (10%) versus 2013, and was primarily attributable to the aforementioned
increases in revenues. In addition, NetJets business benefitted from comparatively lower aircraft impairment and restructuring
charges and financing expenses, partially offset by higher depreciation expense, maintenance costs and subcontracted flight
expenses.
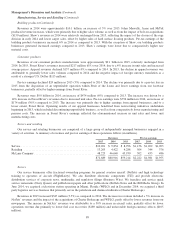
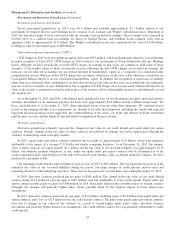
Retailing
Our retailing businesses include four distinct home furnishings retailing businesses (Nebraska Furniture Mart, R.C. Willey,
Star Furniture and Jordan’s), which sell furniture, appliances, flooring and electronics. In the first quarter of 2015, we acquired
The Van Tuyl Group (now named Berkshire Hathaway Automotive or “BHA”) which included 81 auto dealerships located in 10
states. BHA sells new and pre-owned automobiles and offers repair and other related services and products, and includes two
related insurance businesses, two auto auctions and a distributor of automotive fluid maintenance products.
Our other retailing businesses include three jewelry retailing businesses (Borsheims, Helzberg and Ben Bridge), See’s
Candies, which makes and sells confectionary products through its retail stores and quantity order centers, Pampered Chef, a
direct seller of high quality kitchen tools and Oriental Trading Company, a direct retailer of party supplies, school supplies and
toys and novelties. On April 30, 2015, we also acquired Detlev Louis Motorrad (“Louis”), a retailer of motorcycle accessories
based in Germany.
Revenues of our retailing businesses in 2015 increased approximately $8.8 billion as compared to 2014. The increase
reflected the impact of the BHA and Louis acquisitions, which contributed revenues of approximately $8.3 billion. Revenues of
our home furnishings retailers in 2015 increased $572 million (24%) over 2014, driven by Nebraska Furniture Mart, which
opened a new store in March of 2015, and from increases at R.C. Willey and Jordan’s. Retailing earnings increased $220
million in 2015 (64%) compared to 2014. The increase was primarily due to the impact of the BHA and Louis acquisitions.
Revenues in 2014 increased $134 million (3%), while pre-tax earnings declined $32 million (8.5%) compared to 2013. The
earnings decline in 2014 was primarily attributable to lower earnings from Nebraska Furniture Mart, due primarily to start-up
costs related to its new store, and Pampered Chef, due to a decline in sales.
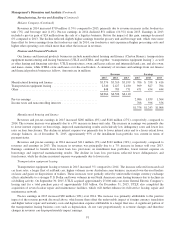
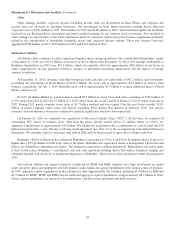
McLane Company
McLane operates a wholesale distribution business that provides grocery and non-food consumer products to retailers and
convenience stores (“grocery unit”) and to restaurants (“foodservice unit”). McLane also operates businesses that are wholesale
distributors of distilled spirits, wine and beer (“beverage unit”). The grocery and foodservice units are marked by high sales
volume and very low profit margins and have several significant customers, including Wal-Mart, 7-Eleven and Yum! Brands. A
curtailment of purchasing by any of its significant customers could have a significant adverse impact on McLane’s periodic
revenues and earnings.
Revenues in 2015 increased $1.6 billion (3%) over 2014, reflecting revenue increases in the foodservice unit (6%),
beverage unit (8%) and grocery unit (2%). Pre-tax earnings in 2015 increased $67 million (15%) versus 2014. Pre-tax earnings
in 2015 included a gain of $19 million from the sale of a subsidiary and otherwise benefitted from lower fuel and trucking costs.
90