Berkshire Hathaway 2015 Annual Report Download - page 50
Download and view the complete annual report
Please find page 50 of the 2015 Berkshire Hathaway annual report below. You can navigate through the pages in the report by either clicking on the pages listed below, or by using the keyword search tool below to find specific information within the annual report.-
 1
1 -
2
-
3
-
4
-
5
-
6
-
7
-
8
-
9
-
10
-
11
-
12
-
13
-
14
-
15
-
16
-
17
-
18
-
19
-
20
-
21
-
22
-
23
-
24
-
25
-
26
-
27
-
28
-
29
-
30
-
31
-
32
-
33
-
34
-
35
-
36
-
37
-
38
-
39
-
 40
40 -
 41
41 -
 42
42 -
 43
43 -
 44
44 -
 45
45 -
 46
46 -
 47
47 -
 48
48 -
 49
49 -
 50
50 -
 51
51 -
 52
52 -
 53
53 -
 54
54 -
 55
55 -
 56
56 -
 57
57 -
 58
58 -
 59
59 -
 60
60 -
61
-
62
-
63
-
64
-
65
-
66
-
67
-
68
-
69
-
70
-
71
-
72
-
73
-
74
-
75
-
76
-
77
-
78
-
79
-
80
-
81
-
82
-
83
-
84
-
85
-
86
-
87
-
88
-
89
-
90
-
91
-
92
-
93
-
94
-
95
-
96
-
97
-
98
-
99
-
100
-
101
-
102
-
103
-
104
-
105
-
106
-
107
-
108
-
109
-
110
-
111
-
112
-
113
-
114
-
115
-
116
-
117
-
118
-
119
-
120
-
121
-
122
-
123
-
124
 |
 |

Notes to Consolidated Financial Statements (Continued)
(2) Significant business acquisitions (Continued)
On December 19, 2013, we acquired NV Energy, Inc. (“NV Energy”) for cash consideration of approximately $5.6 billion.
NV Energy is an energy holding company serving approximately 1.2 million electric and 0.2 million retail natural gas customers
in Nevada. NV Energy’s principal operating subsidiaries, Nevada Power Company and Sierra Pacific Power Company, are
regulated utilities.
During the last three years, we also completed several smaller-sized business acquisitions, many of which were considered
as “bolt-on” acquisitions to several of our existing business operations. Aggregate consideration paid for these other business
acquisitions was approximately $1.1 billion in 2015, $1.8 billion in 2014 and $1.1 billion in 2013. We do not believe that these
acquisitions were material, individually or in the aggregate, to our Consolidated Financial Statements.
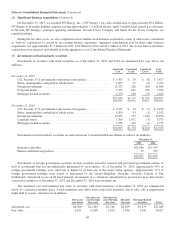
(3) Investments in fixed maturity securities
Investments in securities with fixed maturities as of December 31, 2015 and 2014 are summarized by type below (in
millions).
Amortized
Cost
Unrealized
Gains
Unrealized
Losses
Fair
Value
December 31, 2015
U.S. Treasury, U.S. government corporations and agencies ............... $ 3,425 $ 10 $ (8) $ 3,427
States, municipalities and political subdivisions ........................ 1,695 71 (2) 1,764
Foreign governments ............................................. 11,327 226 (85) 11,468
Corporate bonds ................................................. 7,323 632 (29) 7,926
Mortgage-backed securities ........................................ 1,279 168 (5) 1,442
$25,049 $1,107 $(129) $26,027
December 31, 2014
U.S. Treasury, U.S. government corporations and agencies ............... $ 2,921 $ 14 $ (5) $ 2,930
States, municipalities and political subdivisions ........................ 1,820 93 (1) 1,912
Foreign governments ............................................. 12,023 373 (126) 12,270
Corporate bonds ................................................. 7,704 1,072 (5) 8,771
Mortgage-backed securities ........................................ 1,555 202 (4) 1,753
$26,023 $1,754 $(141) $27,636
Investments in fixed maturity securities are reflected in our Consolidated Balance Sheets as follows (in millions).
December 31,
2015 2014
Insurance and other ............................................................ $25,988 $27,397
Finance and financial products ................................................... 39 239
$26,027 $27,636
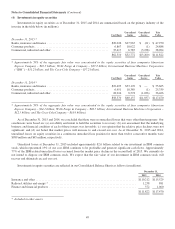
Investments in foreign government securities include securities issued by national and provincial government entities as
well as instruments that are unconditionally guaranteed by such entities. As of December 31, 2015, approximately 94% of
foreign government holdings were rated AA or higher by at least one of the major rating agencies. Approximately 77% of
foreign government holdings were issued or guaranteed by the United Kingdom, Germany, Australia, Canada or The
Netherlands. Unrealized losses on all fixed maturity investments in a continuous unrealized loss position for more than twelve
consecutive months as of December 31, 2015 and December 31, 2014 were insignificant.
The amortized cost and estimated fair value of securities with fixed maturities at December 31, 2015 are summarized
below by contractual maturity dates. Actual maturities may differ from contractual maturities due to early call or prepayment
rights held by issuers. Amounts are in millions.
Due in one
year or less
Due after one
year through
five years
Due after five
years through
ten years
Due after
ten years
Mortgage-backed
securities Total
Amortized cost .......................... $6,900 $12,483 $1,748 $2,639 $1,279 $25,049
Fair value .............................. 6,921 12,889 1,829 2,946 1,442 26,027
48