Berkshire Hathaway 2015 Annual Report Download - page 90
Download and view the complete annual report
Please find page 90 of the 2015 Berkshire Hathaway annual report below. You can navigate through the pages in the report by either clicking on the pages listed below, or by using the keyword search tool below to find specific information within the annual report.-
 1
1 -
2
-
3
-
4
-
5
-
6
-
7
-
8
-
9
-
10
-
11
-
12
-
13
-
14
-
15
-
16
-
17
-
18
-
19
-
20
-
21
-
22
-
23
-
24
-
25
-
26
-
27
-
28
-
29
-
30
-
31
-
32
-
33
-
34
-
35
-
36
-
37
-
38
-
39
-
40
-
41
-
42
-
43
-
44
-
45
-
46
-
47
-
48
-
49
-
50
-
51
-
52
-
53
-
54
-
55
-
56
-
57
-
58
-
59
-
60
-
61
-
62
-
63
-
64
-
65
-
66
-
67
-
68
-
69
-
70
-
71
-
72
-
73
-
74
-
75
-
76
-
77
-
78
-
79
-
 80
80 -
 81
81 -
 82
82 -
 83
83 -
 84
84 -
 85
85 -
 86
86 -
 87
87 -
 88
88 -
 89
89 -
 90
90 -
 91
91 -
 92
92 -
 93
93 -
 94
94 -
 95
95 -
 96
96 -
 97
97 -
 98
98 -
 99
99 -
 100
100 -
101
-
102
-
103
-
104
-
105
-
106
-
107
-
108
-
109
-
110
-
111
-
112
-
113
-
114
-
115
-
116
-
117
-
118
-
119
-
120
-
121
-
122
-
123
-
124
 |
 |

Management’s Discussion and Analysis (Continued)
Manufacturing, Service and Retailing (Continued)
Manufacturing (Continued)
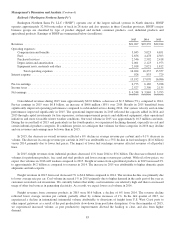
consumer products businesses include leisure vehicles (Forest River), six apparel and footwear operations (led by Fruit of the
Loom, which includes Russell athletic apparel and Vanity Fair Brands women’s intimate apparel), custom picture framing
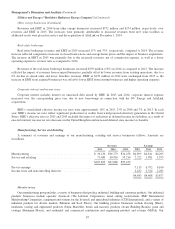
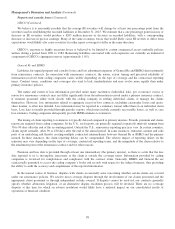
products (Larson Juhl) and jewelry products (Richline). A summary of revenues and pre-tax earnings of our manufacturing
operations follows (in millions).
Revenues Pre-tax earnings
2015 2014 2013 2015 2014 2013
Industrial products ........................................ $16,760 $17,622 $16,065 $2,994 $3,159 $2,777
Building products ........................................ 10,316 10,124 9,640 1,167 896 846
Consumer products ....................................... 9,060 9,027 8,553 732 756 582
$36,136 $36,773 $34,258 $4,893 $4,811 $4,205
Aggregate revenues of our manufacturers were $36.1 billion in 2015, a decline of $637 million (2%) from 2014. Pre-tax
earnings from manufacturing activities were $4.9 billion in 2015, an increase of $82 million (2%) versus 2014. In 2015,
operating results of our industrial products and consumer products businesses were generally lower than earnings in 2014.
Earnings of our building products businesses were higher than in 2014.
Industrial products
Revenues in 2015 of our industrial products manufacturers declined $862 million (5%) versus 2014. The foreign currency
translation impact of a stronger U.S. Dollar produced $782 million of the comparative revenue decline. In addition, commodity
cost deflation in petroleum and metals used in certain of our products resulted in lower average selling prices, in particular for
specialty chemicals, metal cutting tools, copper wire and plumbing products. Certain of our businesses experienced slowing
customer demand over the last half of the year as the decline in oil prices and competitive pressures resulted in significantly
lower sales volumes to customers in or related to the oil and gas industry. The negative effect of foreign currency translation and
lower selling prices in 2015 was partially offset by the impact of bolt-on acquisitions by Lubrizol ($433 million).
Pre-tax earnings in 2015 of these businesses declined $165 million (5%) compared to 2014. The average pre-tax margin
rate was 17.9% in 2015 and 2014. The comparative declines in earnings in 2015 reflected the adverse impact of the stronger
U.S. Dollar, partially offset by earnings from bolt-on acquisitions, lower average commodity-based material costs, and actions
taken in response to the slowing sales volumes previously referenced. Such actions address cost structures and exiting lower
margin business. Our businesses expect soft market conditions in 2016 and expect to take additional actions as necessary, in
response to further slowdowns in customer demand.
Revenues in 2014 increased approximately $1.6 billion (10%) in comparison to 2013. The increase in revenues reflected
the impact of bolt-on acquisitions by Lubrizol and Marmon (approximately $1.3 billion). In 2014, we also experienced revenue
growth in several business markets, most notably for the metal cutting tools and at certain Marmon business units (commercial
trailer and aftermarket brake drum products and water treatment systems). These increases were substantially offset by revenue
declines from certain other Marmon business units due to lower copper prices and lower volumes in the electrical and plumbing
products.
Pre-tax earnings in 2014 increased $382 million (14%) over 2013 and average pre-tax margins were 17.9% in 2014 and
17.3% in 2013. The increase in earnings in 2014 was primarily due to the impact of bolt-on acquisitions ($213 million),
increased sales and cost savings and restructuring initiatives.
Building products
Revenues in 2015 of our building products manufacturers increased $192 million (2%) over 2014. In 2015, the revenue
increase reflected sales volume increases at Shaw, Johns Manville and MiTek, as well as the impact of bolt-on business
acquisitions. These revenue increases were partially offset by the adverse impact of foreign currency translation from a stronger
U.S. Dollar ($165 million). Pre-tax earnings increased $271 million (30%) compared to 2014. The overall increase in earnings
was primarily attributable to the aforementioned increases in revenues and lower average raw material and energy costs,
partially offset by the negative impact of foreign currency translation and increased restructuring charges. Most of the
comparative increases in earnings were generated by Shaw, Johns Manville and Benjamin Moore.
88