Berkshire Hathaway 2015 Annual Report Download - page 63
Download and view the complete annual report
Please find page 63 of the 2015 Berkshire Hathaway annual report below. You can navigate through the pages in the report by either clicking on the pages listed below, or by using the keyword search tool below to find specific information within the annual report.-
 1
1 -
2
-
3
-
4
-
5
-
6
-
7
-
8
-
9
-
10
-
11
-
12
-
13
-
14
-
15
-
16
-
17
-
18
-
19
-
20
-
21
-
22
-
23
-
24
-
25
-
26
-
27
-
28
-
29
-
30
-
31
-
32
-
33
-
34
-
35
-
36
-
37
-
38
-
39
-
40
-
41
-
42
-
43
-
44
-
45
-
46
-
47
-
48
-
49
-
50
-
51
-
52
-
 53
53 -
 54
54 -
 55
55 -
 56
56 -
 57
57 -
 58
58 -
 59
59 -
 60
60 -
 61
61 -
 62
62 -
 63
63 -
 64
64 -
 65
65 -
 66
66 -
 67
67 -
 68
68 -
 69
69 -
 70
70 -
 71
71 -
 72
72 -
 73
73 -
74
-
75
-
76
-
77
-
78
-
79
-
80
-
81
-
82
-
83
-
84
-
85
-
86
-
87
-
88
-
89
-
90
-
91
-
92
-
93
-
94
-
95
-
96
-
97
-
98
-
99
-
100
-
101
-
102
-
103
-
104
-
105
-
106
-
107
-
108
-
109
-
110
-
111
-
112
-
113
-
114
-
115
-
116
-
117
-
118
-
119
-
120
-
121
-
122
-
123
-
124
 |
 |

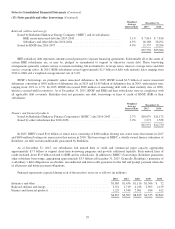
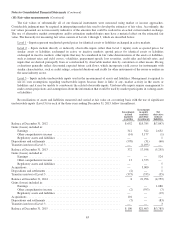
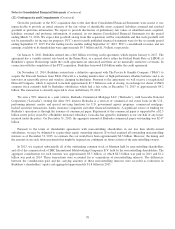
Notes to Consolidated Financial Statements (Continued)
(16) Income taxes (Continued)
Income tax expense is reconciled to hypothetical amounts computed at the U.S. federal statutory rate for each of the three
years ending December 31, 2015 in the table below (in millions).
2015 2014 2013
Earnings before income taxes ..................................................... $34,946 $28,105 $28,796
Hypothetical income tax expense computed at the U.S. federal statutory rate ................ $12,231 $ 9,837 $10,079
Dividends received deduction and tax exempt interest .................................. (1,146) (820) (514)
State income taxes, less U.S. federal income tax benefit ................................. 374 364 168
Foreign tax rate differences ....................................................... (459) (252) (256)
U.S. income tax credits .......................................................... (461) (333) (457)
Non-taxable exchange of investments ............................................... — (679) —
Other differences, net ............................................................ (7) (182) (69)
$10,532 $ 7,935 $ 8,951
We file income tax returns in the United States and in state, local and foreign jurisdictions. We are under examination by
the taxing authorities in many of these jurisdictions. We have settled tax return liabilities with U.S. federal taxing authorities for
years before 2010. The IRS continues to audit Berkshire’s consolidated U.S. federal income tax returns for the 2010 and 2011
tax years and has commenced an examination of the 2012 and 2013 tax years. We are also under audit or subject to audit with
respect to income taxes in many state and foreign jurisdictions. It is reasonably possible that certain of our income tax
examinations will be settled within the next twelve months. We currently do not believe that the outcome of unresolved issues
or claims is likely to be material to our Consolidated Financial Statements.
At December 31, 2015 and 2014, net unrecognized tax benefits were $570 million and $645 million, respectively. Included
in the balance at December 31, 2015, were $435 million of tax positions that, if recognized, would impact the effective tax rate.
The remaining balance in net unrecognized tax benefits principally relates to tax positions where the ultimate recognition is
highly certain but there is uncertainty about the timing of such recognition. Because of the impact of deferred tax accounting,
the differences in recognition periods would not affect the annual effective tax rate but would accelerate the payment of cash to
the taxing authority to an earlier period. As of December 31, 2015, we do not expect any material changes to the estimated
amount of unrecognized tax benefits in the next twelve months.
(17) Dividend restrictions – Insurance subsidiaries
Payments of dividends by our insurance subsidiaries are restricted by insurance statutes and regulations. Without prior
regulatory approval, our principal insurance subsidiaries may declare up to approximately $13 billion as ordinary dividends
during 2016.
Combined shareholders’ equity of U.S. based insurance subsidiaries determined pursuant to statutory accounting rules
(Surplus as Regards Policyholders) was approximately $124 billion at December 31, 2015 and $129 billion at December 31,
2014. Statutory surplus differs from the corresponding amount determined on the basis of GAAP due to differences in
accounting for certain assets and liabilities. For instance, deferred charges reinsurance assumed, deferred policy acquisition
costs, unrealized gains on certain investments and related deferred income taxes are recognized for GAAP but not for statutory
reporting purposes. In addition, the carrying values of certain assets, such as goodwill and non-insurance entities owned by our
insurance subsidiaries, are not fully recognized for statutory reporting purposes.
61