Berkshire Hathaway 2015 Annual Report Download - page 76
Download and view the complete annual report
Please find page 76 of the 2015 Berkshire Hathaway annual report below. You can navigate through the pages in the report by either clicking on the pages listed below, or by using the keyword search tool below to find specific information within the annual report.-
 1
1 -
2
-
3
-
4
-
5
-
6
-
7
-
8
-
9
-
10
-
11
-
12
-
13
-
14
-
15
-
16
-
17
-
18
-
19
-
20
-
21
-
22
-
23
-
24
-
25
-
26
-
27
-
28
-
29
-
30
-
31
-
32
-
33
-
34
-
35
-
36
-
37
-
38
-
39
-
40
-
41
-
42
-
43
-
44
-
45
-
46
-
47
-
48
-
49
-
50
-
51
-
52
-
53
-
54
-
55
-
56
-
57
-
58
-
59
-
60
-
61
-
62
-
63
-
64
-
65
-
 66
66 -
 67
67 -
 68
68 -
 69
69 -
 70
70 -
 71
71 -
 72
72 -
 73
73 -
 74
74 -
 75
75 -
 76
76 -
 77
77 -
 78
78 -
 79
79 -
 80
80 -
 81
81 -
 82
82 -
 83
83 -
 84
84 -
 85
85 -
 86
86 -
87
-
88
-
89
-
90
-
91
-
92
-
93
-
94
-
95
-
96
-
97
-
98
-
99
-
100
-
101
-
102
-
103
-
104
-
105
-
106
-
107
-
108
-
109
-
110
-
111
-
112
-
113
-
114
-
115
-
116
-
117
-
118
-
119
-
120
-
121
-
122
-
123
-
124
 |
 |

Notes to Consolidated Financial Statements (Continued)
(23) Business segment data (Continued)
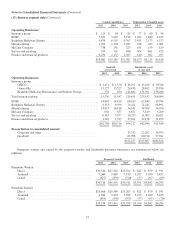
Insurance premiums written by geographic region (based upon the domicile of the insured or reinsured) are summarized
below. Dollars are in millions.
Property/Casualty Life/Health
2015 2014 2013 2015 2014 2013
United States ............................................ $31,171 $31,362 $25,704 $3,247 $3,402 $3,934
Asia Pacific ............................................. 3,472 1,953 2,353 673 651 420
Western Europe .......................................... 1,638 2,424 2,234 1,263 1,135 1,339
All other ................................................ 435 852 620 768 654 606
$36,716 $36,591 $30,911 $5,951 $5,842 $6,299
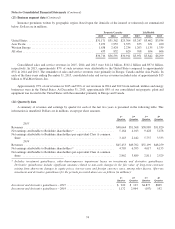
Consolidated sales and service revenues in 2015, 2014 and 2013 were $112.4 billion, $102.2 billion and $97.6 billion,
respectively. In 2015, approximately 87% of such revenues were attributable to the United States compared to approximately
85% in 2014 and 2013. The remainder of sales and service revenues were primarily in Europe, Canada and the Asia Pacific. In
each of the three years ending December 31, 2015, consolidated sales and service revenues included sales of approximately $13
billion to Wal-Mart Stores, Inc.
Approximately 95% of our revenues in 2015 and 96% of our revenues in 2014 and 2013 from railroad, utilities and energy
businesses were in the United States. At December 31, 2015, approximately 89% of our consolidated net property, plant and
equipment was located in the United States with the remainder primarily in Europe and Canada.
(24) Quarterly data
A summary of revenues and earnings by quarter for each of the last two years is presented in the following table. This
information is unaudited. Dollars are in millions, except per share amounts.
1st
Quarter
2nd
Quarter
3rd
Quarter
4th
Quarter
2015
Revenues ............................................................. $48,644 $51,368 $58,989 $51,820
Net earnings attributable to Berkshire shareholders * .......................... 5,164 4,013 9,428 5,478
Net earnings attributable to Berkshire shareholders per equivalent Class A common
share .............................................................. 3,143 2,442 5,737 3,333
2014
Revenues ............................................................. $45,453 $49,762 $51,199 $48,259
Net earnings attributable to Berkshire shareholders * .......................... 4,705 6,395 4,617 4,155
Net earnings attributable to Berkshire shareholders per equivalent Class A common
share .............................................................. 2,862 3,889 2,811 2,529
*Includes investment gains/losses, other-than-temporary impairment losses on investments and derivative gains/losses.
Derivative gains/losses include significant amounts related to non-cash changes in the fair value of long-term contracts
arising from short-term changes in equity prices, interest rates and foreign currency rates, among other factors. After-tax
investment and derivative gains/losses for the periods presented above are as follows (in millions):
1st
Quarter
2nd
Quarter
3rd
Quarter
4th
Quarter
Investment and derivative gains/losses – 2015 ................................ $ 920 $ 123 $4,877 $805
Investment and derivative gains/losses – 2014 ................................ 1,172 2,064 (107) 192
74