Berkshire Hathaway 2015 Annual Report Download - page 80
Download and view the complete annual report
Please find page 80 of the 2015 Berkshire Hathaway annual report below. You can navigate through the pages in the report by either clicking on the pages listed below, or by using the keyword search tool below to find specific information within the annual report.-
 1
1 -
2
-
3
-
4
-
5
-
6
-
7
-
8
-
9
-
10
-
11
-
12
-
13
-
14
-
15
-
16
-
17
-
18
-
19
-
20
-
21
-
22
-
23
-
24
-
25
-
26
-
27
-
28
-
29
-
30
-
31
-
32
-
33
-
34
-
35
-
36
-
37
-
38
-
39
-
40
-
41
-
42
-
43
-
44
-
45
-
46
-
47
-
48
-
49
-
50
-
51
-
52
-
53
-
54
-
55
-
56
-
57
-
58
-
59
-
60
-
61
-
62
-
63
-
64
-
65
-
66
-
67
-
68
-
69
-
 70
70 -
 71
71 -
 72
72 -
 73
73 -
 74
74 -
 75
75 -
 76
76 -
 77
77 -
 78
78 -
 79
79 -
 80
80 -
 81
81 -
 82
82 -
 83
83 -
 84
84 -
 85
85 -
 86
86 -
 87
87 -
 88
88 -
 89
89 -
 90
90 -
91
-
92
-
93
-
94
-
95
-
96
-
97
-
98
-
99
-
100
-
101
-
102
-
103
-
104
-
105
-
106
-
107
-
108
-
109
-
110
-
111
-
112
-
113
-
114
-
115
-
116
-
117
-
118
-
119
-
120
-
121
-
122
-
123
-
124
 |
 |

Management’s Discussion and Analysis (Continued)
Insurance—Underwriting (Continued)
General Re
General Re conducts a reinsurance business offering property and casualty and life and health coverages to clients
worldwide. We write property and casualty reinsurance in North America on a direct basis through General Reinsurance
Corporation and internationally through Germany-based General Reinsurance AG and other wholly-owned affiliates. Property
and casualty reinsurance is also written in broker markets through Faraday in London. Life and health reinsurance is written in
North America through General Re Life Corporation and internationally through General Reinsurance AG. General Re strives to
generate underwriting profits in essentially all of its product lines. Our management does not evaluate underwriting performance
based upon market share and our underwriters are instructed to reject inadequately priced risks. In 2015, we changed the
allocation of certain underwriting expenses related to a global systems implementation project among our business units. There
was no impact on consolidated results. Prior year amounts were reclassified to conform to current year presentations. General
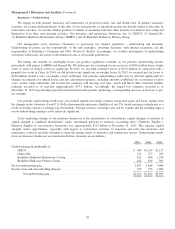
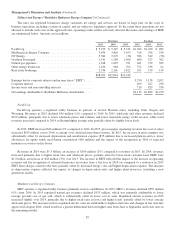
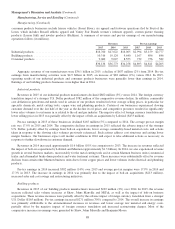
Re’s underwriting results are summarized in the following table. Amounts are in millions.
Premiums written Premiums earned Pre-tax underwriting gain (loss)
2015 2014 2013 2015 2014 2013 2015 2014 2013
Property/casualty .................. $2,725 $3,257 $2,972 $2,805 $3,103 $3,007 $150 $204 $171
Life/health ........................ 3,165 3,161 2,991 3,170 3,161 2,977 (18) 73 112
$5,890 $6,418 $5,963 $5,975 $6,264 $5,984 $132 $277 $283
Property/casualty
In 2015, property/casualty premiums written declined $532 million (16%), while premiums earned decreased $298 million
(10%), as compared to 2014. Adjusting for changes in foreign currency exchange rates, premiums written and earned in 2015
declined 9% and 2%, respectively, compared to 2014. Our premium volume declined in both the direct and broker markets
worldwide. Insurance industry capacity remains high and price competition in most property/casualty reinsurance markets
persists. We continue to decline business when we believe prices are inadequate. However, we remain prepared to write
substantially more business when more appropriate prices can be attained relative to the risks assumed.
Our property/casualty business produced pre-tax underwriting gains of $150 million in 2015 and $204 million in 2014. In
2015, our property business generated pre-tax underwriting gains of $289 million compared to $445 million in 2014. The
comparative decrease in underwriting gains from property business was driven by an increase in the current accident year loss
ratio, reflecting a relative increase in reported losses. The property results in 2015 included estimated incurred losses of $50
million from an explosion in Tianjin, China. There were no significant catastrophe losses during 2014. Our property business
results in both years benefitted from reductions of estimated losses for prior years’ exposures. The timing and magnitude of
catastrophe and large individual losses can produce significant volatility in our periodic underwriting results.
In 2015 and 2014, our casualty/workers’ compensation business produced pre-tax underwriting losses of $139 million and
$241 million, respectively. Underwriting results in each year included net losses on current year business, driven by our prudent
reserving philosophy that reflects the inherent uncertainty in long-tail exposures. These losses were partially offset by gains
from reductions of estimated losses on prior years’ business of $150 million in 2015 and $123 million in 2014, which were net
of recurring charges for discount accretion on workers’ compensation liabilities and deferred charge amortization on retroactive
reinsurance contracts. Casualty losses tend to be long-tail and it should not be assumed that favorable loss experience in a given
period means that the ultimate liability estimates currently established will continue to develop favorably.
Premiums written and earned in 2014 increased $285 million (9.6%) and $96 million (3.2%), respectively, compared to
2013. Adjusting for changes in foreign currency exchange rates, premiums written and earned in 2014 increased 8% and 3%,
respectively, reflecting increases in treaty participations as well as growth in our facultative and primary casualty businesses.
Our property/casualty business produced pre-tax underwriting gains of $204 million in 2014 and $171 million in 2013. Our
property business generated pre-tax underwriting gains of $445 million in 2014 and $140 million in 2013. Underwriting results in
2013 included $400 million of catastrophe losses primarily attributable to a hailstorm ($280 million) and floods ($120 million) in
Europe. In both 2014 and 2013, property results benefitted from reductions of estimated ultimate losses for prior years’ exposures. The
favorable development in each period was primarily attributable to lower than expected losses reported from ceding companies.
Our casualty/workers’ compensation business produced pre-tax underwriting losses of $241 million in 2014 and
underwriting gains of $31 million in 2013. Casualty/workers’ compensation underwriting results included gains from reductions
of estimated ultimate losses on prior years’ business of $123 million in 2014 and $354 million in 2013, which included charges
related to discount accretion on workers’ compensation liabilities and amortization of deferred charges pertaining to retroactive
reinsurance contracts.
78