Berkshire Hathaway 2015 Annual Report Download - page 104
Download and view the complete annual report
Please find page 104 of the 2015 Berkshire Hathaway annual report below. You can navigate through the pages in the report by either clicking on the pages listed below, or by using the keyword search tool below to find specific information within the annual report.-
 1
1 -
2
-
3
-
4
-
5
-
6
-
7
-
8
-
9
-
10
-
11
-
12
-
13
-
14
-
15
-
16
-
17
-
18
-
19
-
20
-
21
-
22
-
23
-
24
-
25
-
26
-
27
-
28
-
29
-
30
-
31
-
32
-
33
-
34
-
35
-
36
-
37
-
38
-
39
-
40
-
41
-
42
-
43
-
44
-
45
-
46
-
47
-
48
-
49
-
50
-
51
-
52
-
53
-
54
-
55
-
56
-
57
-
58
-
59
-
60
-
61
-
62
-
63
-
64
-
65
-
66
-
67
-
68
-
69
-
70
-
71
-
72
-
73
-
74
-
75
-
76
-
77
-
78
-
79
-
80
-
81
-
82
-
83
-
84
-
85
-
86
-
87
-
88
-
89
-
90
-
91
-
92
-
93
-
 94
94 -
 95
95 -
 96
96 -
 97
97 -
 98
98 -
 99
99 -
 100
100 -
 101
101 -
 102
102 -
 103
103 -
 104
104 -
 105
105 -
 106
106 -
 107
107 -
 108
108 -
 109
109 -
 110
110 -
 111
111 -
 112
112 -
 113
113 -
 114
114 -
115
-
116
-
117
-
118
-
119
-
120
-
121
-
122
-
123
-
124
 |
 |

Management’s Discussion and Analysis (Continued)
Property and casualty losses (Continued)
BHRG (Continued)
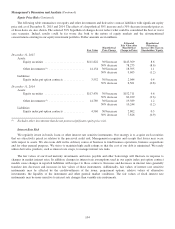
Gross unpaid losses and loss adjustment expense liabilities related to property and casualty contracts, other than retroactive
reinsurance, were approximately $11.7 billion as of December 31, 2015 and consisted of traditional property and casualty
coverages written primarily under excess-of-loss and quota-share treaties, and to a lesser extent, under individual risk contracts.
These coverages included catastrophe and aviation contracts that periodically generate low frequency/high severity losses.
Reserving techniques for catastrophe and individual risk contracts generally rely more on a per-policy assessment of the
ultimate cost associated with the individual loss event rather than with an analysis of the historical development patterns of past
losses. Absent litigation affecting the interpretation of coverage terms, the expected claim-tail is relatively short and thus the
estimation error in the initial reserve estimates usually emerges within 24 months after the loss event.
Under most of our non-catastrophe property and casualty treaties, liabilities for unpaid losses and loss adjustments
expenses are generally based upon loss estimates reported by ceding companies and IBNR reserves that are primarily a function
of reported losses from ceding companies and anticipated loss ratios established on a portfolio basis, supplemented by
management’s estimates of the impact of major catastrophe events as they become known. Anticipated loss ratios are based
upon management’s judgment considering the type of business covered, analysis of each ceding company’s loss history and
evaluation of that portion of the underlying contracts underwritten by each ceding company, which are in turn ceded to BHRG.
A range of reserve amounts as a result of changes in underlying assumptions is not prepared. For BHRG’s property/casualty
contracts other than retroactive reinsurance, we decreased estimated ultimate losses for prior years’ occurrences by
approximately $728 million in 2015, which primarily derived from lower than expected losses reported by ceding companies.
The decrease produced a corresponding increase in pre-tax earnings.
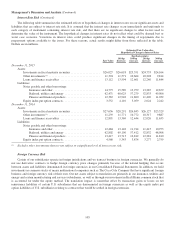
Derivative contract liabilities
Our Consolidated Balance Sheets include derivative contract liabilities that are measured at fair value. Our most significant
derivative contract exposures relate to equity index put option contracts written between 2004 and 2008. These contracts were
entered into in over-the-counter markets. We believe that the fair values produced for long-duration options are inherently
subjective. The values of contracts in an actual exchange are affected by market conditions and perceptions of the buyers and
sellers. Actual values in an exchange may differ significantly from the values produced by any mathematical model.
We determine the estimated fair value of equity index put option contracts using a Black-Scholes based option valuation
model. Inputs to the model include the current index value, strike price, interest rate, dividend rate and contract expiration date.
The weighted average interest and dividend rates used as of December 31, 2015 and December 31, 2014 were 1.5% and 3.3%,
respectively. The interest rates as of December 31, 2015 and 2014 were approximately 63 basis points and 53 basis points (on a
weighted average basis), respectively, over benchmark interest rates and represented our estimate of our nonperformance risk.
We believe that the most significant economic risks under these contracts relate to changes in the index value component and, to
a lesser degree, the foreign currency component.
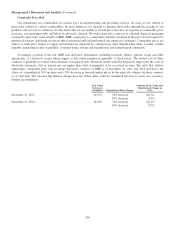
The Black-Scholes based model also incorporates volatility estimates that measure potential price changes over time. Our
contracts have an average remaining maturity of about 5 years. The weighted average volatility used as of December 31, 2015
was approximately 21.0%, compared to 20.9% as of December 31, 2014. The weighted average volatilities are based on the
volatility input for each contract weighted by the contract notional value. The volatility input for each contract reflects our
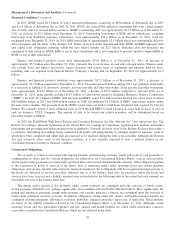
expectation of future price volatility. The impact on fair value as of December 31, 2015 ($3.6 billion) from changes in the
volatility assumption is summarized in the table that follows. Dollars are in millions.
Hypothetical change in volatility Hypothetical fair value
Increase 2 percentage points .............................................................. $3,836
Increase 4 percentage points .............................................................. 4,132
Decrease 2 percentage points .............................................................. 3,284
Decrease 4 percentage points .............................................................. 3,033
For several years, we also wrote a number of credit default contracts involving corporate and state/municipality issuers. At
December 31, 2015, our remaining exposures relate to state/municipality exposures which begin to expire in 2019. The fair
value of our state/municipality contract is generally based on pricing data and current ratings on the underlying bond issues and
credit spread estimates. We monitor and review pricing data and spread estimates for consistency as well as reasonableness with
respect to current market conditions.
102