Berkshire Hathaway 2015 Annual Report Download - page 106
Download and view the complete annual report
Please find page 106 of the 2015 Berkshire Hathaway annual report below. You can navigate through the pages in the report by either clicking on the pages listed below, or by using the keyword search tool below to find specific information within the annual report.-
 1
1 -
2
-
3
-
4
-
5
-
6
-
7
-
8
-
9
-
10
-
11
-
12
-
13
-
14
-
15
-
16
-
17
-
18
-
19
-
20
-
21
-
22
-
23
-
24
-
25
-
26
-
27
-
28
-
29
-
30
-
31
-
32
-
33
-
34
-
35
-
36
-
37
-
38
-
39
-
40
-
41
-
42
-
43
-
44
-
45
-
46
-
47
-
48
-
49
-
50
-
51
-
52
-
53
-
54
-
55
-
56
-
57
-
58
-
59
-
60
-
61
-
62
-
63
-
64
-
65
-
66
-
67
-
68
-
69
-
70
-
71
-
72
-
73
-
74
-
75
-
76
-
77
-
78
-
79
-
80
-
81
-
82
-
83
-
84
-
85
-
86
-
87
-
88
-
89
-
90
-
91
-
92
-
93
-
94
-
95
-
 96
96 -
 97
97 -
 98
98 -
 99
99 -
 100
100 -
 101
101 -
 102
102 -
 103
103 -
 104
104 -
 105
105 -
 106
106 -
 107
107 -
 108
108 -
 109
109 -
 110
110 -
 111
111 -
 112
112 -
 113
113 -
 114
114 -
 115
115 -
 116
116 -
117
-
118
-
119
-
120
-
121
-
122
-
123
-
124
 |
 |

Management’s Discussion and Analysis (Continued)
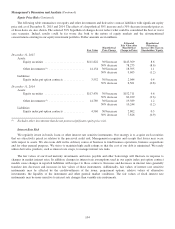
Equity Price Risk (Continued)
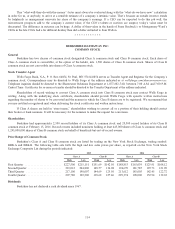
The following table summarizes our equity and other investments and derivative contract liabilities with significant equity
price risk as of December 31, 2015 and 2014. The effects of a hypothetical 30% increase and a 30% decrease in market prices as
of those dates are also shown. The selected 30% hypothetical changes do not reflect what could be considered the best or worst
case scenarios. Indeed, results could be far worse due both to the nature of equity markets and the aforementioned
concentrations existing in our equity investment portfolio. Dollar amounts are in millions.
Fair Value
Hypothetical
Price Change
Estimated
Fair Value after
Hypothetical
Change in Prices
Hypothetical
Percentage
Increase (Decrease) in
Shareholders’ Equity
December 31, 2015
Assets:
Equity securities ........................... $111,822 30%increase $145,369 8.6
30% decrease 78,275 (8.6)
Other investments (1) ........................ 14,154 30%increase 18,395 1.1
30% decrease 9,605 (1.2)
Liabilities:
Equity index put option contracts .............. 3,552 30%increase 2,044 0.4
30% decrease 6,561 (0.8)
December 31, 2014
Assets:
Equity securities ........................... $117,470 30%increase $152,711 9.6
30% decrease 82,229 (9.6)
Other investments (1) ........................ 14,789 30%increase 19,389 1.2
30% decrease 10,244 (1.2)
Liabilities:
Equity index put option contracts .............. 4,560 30%increase 2,802 0.5
30% decrease 7,826 (0.9)
(1) Excludes other investments that do not possess significant equity price risk.
Interest Rate Risk
We regularly invest in bonds, loans or other interest rate sensitive instruments. Our strategy is to acquire such securities
that are attractively priced in relation to the perceived credit risk. Management recognizes and accepts that losses may occur
with respect to assets. We also issue debt in the ordinary course of business to fund business operations, business acquisitions
and for other general purposes. We strive to maintain high credit ratings so that the cost of our debt is minimized. We rarely
utilize derivative products, such as interest rate swaps, to manage interest rate risks.
The fair values of our fixed maturity investments and notes payable and other borrowings will fluctuate in response to
changes in market interest rates. In addition, changes in interest rate assumptions used in our equity index put option contract
models cause changes in reported liabilities with respect to those contracts. Increases and decreases in interest rates generally
translate into decreases and increases in fair values of those instruments. Additionally, fair values of interest rate sensitive
instruments may be affected by the creditworthiness of the issuer, prepayment options, relative values of alternative
investments, the liquidity of the instrument and other general market conditions. The fair values of fixed interest rate
instruments may be more sensitive to interest rate changes than variable rate instruments.
104