Berkshire Hathaway 2015 Annual Report Download - page 17
Download and view the complete annual report
Please find page 17 of the 2015 Berkshire Hathaway annual report below. You can navigate through the pages in the report by either clicking on the pages listed below, or by using the keyword search tool below to find specific information within the annual report.-
 1
1 -
2
-
3
-
4
-
5
-
6
-
 7
7 -
 8
8 -
 9
9 -
 10
10 -
 11
11 -
 12
12 -
 13
13 -
 14
14 -
 15
15 -
 16
16 -
 17
17 -
 18
18 -
 19
19 -
 20
20 -
 21
21 -
 22
22 -
 23
23 -
 24
24 -
 25
25 -
 26
26 -
 27
27 -
28
-
29
-
30
-
31
-
32
-
33
-
34
-
35
-
36
-
37
-
38
-
39
-
40
-
41
-
42
-
43
-
44
-
45
-
46
-
47
-
48
-
49
-
50
-
51
-
52
-
53
-
54
-
55
-
56
-
57
-
58
-
59
-
60
-
61
-
62
-
63
-
64
-
65
-
66
-
67
-
68
-
69
-
70
-
71
-
72
-
73
-
74
-
75
-
76
-
77
-
78
-
79
-
80
-
81
-
82
-
83
-
84
-
85
-
86
-
87
-
88
-
89
-
90
-
91
-
92
-
93
-
94
-
95
-
96
-
97
-
98
-
99
-
100
-
101
-
102
-
103
-
104
-
105
-
106
-
107
-
108
-
109
-
110
-
111
-
112
-
113
-
114
-
115
-
116
-
117
-
118
-
119
-
120
-
121
-
122
-
123
-
124
 |
 |

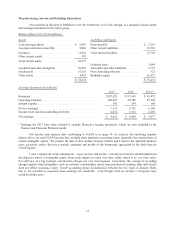
Manufacturing, Service and Retailing Operations
Our activities in this part of Berkshire cover the waterfront. Let’s look, though, at a summary balance sheet
and earnings statement for the entire group.
Balance Sheet 12/31/15 (in millions)
Assets Liabilities and Equity
Cash and equivalents .................. $ 6,807 Notes payable ...................... $ 2,135
Accounts and notes receivable ........... 8,886 Other current liabilities ............... 10,565
Inventory ............................ 11,916 Total current liabilities ............... 12,700
Other current assets ................... 970
Total current assets .................... 28,579
Deferred taxes ...................... 3,649
Goodwill and other intangibles .......... 30,289 Term debt and other liabilities ......... 4,767
Fixed assets .......................... 15,161 Non-controlling interests ............. 521
Other assets .......................... 4,445 Berkshire equity .................... 56,837
$ 78,474 $ 78,474
Earnings Statement (in millions)
2015 2014 2013*
Revenues ............................................... $107,825 $ 97,689 $ 93,472
Operating expenses ....................................... 100,607 90,788 87,208
Interest expense ......................................... 103 109 104
Pre-tax earnings ......................................... 7,115 6,792 6,160
Income taxes and non-controlling interests .................... 2,432 2,324 2,283
Net earnings ............................................ $ 4,683 $ 4,468 $ 3,877
* Earnings for 2013 have been restated to exclude Marmon’s leasing operations, which are now included in the
Finance and Financial Products results.
Our income and expense data conforming to GAAP is on page 38. In contrast, the operating expense
figures above are non-GAAP because they exclude some purchase-accounting items (primarily the amortization of
certain intangible assets). We present the data in this manner because Charlie and I believe the adjusted numbers
more accurately reflect the true economic expenses and profits of the businesses aggregated in the table than do
GAAP figures.
I won’t explain all of the adjustments – some are tiny and arcane – but serious investors should understand
the disparate nature of intangible assets. Some truly deplete in value over time, while others in no way lose value.
For software, as a big example, amortization charges are very real expenses. Conversely, the concept of recording
charges against other intangibles, such as customer relationships, arises from purchase-accounting rules and clearly
does not reflect economic reality. GAAP accounting draws no distinction between the two types of charges. Both,
that is, are recorded as expenses when earnings are calculated – even though, from an investor’s viewpoint, they
could not differ more.
15