Berkshire Hathaway 2015 Annual Report Download - page 60
Download and view the complete annual report
Please find page 60 of the 2015 Berkshire Hathaway annual report below. You can navigate through the pages in the report by either clicking on the pages listed below, or by using the keyword search tool below to find specific information within the annual report.-
 1
1 -
2
-
3
-
4
-
5
-
6
-
7
-
8
-
9
-
10
-
11
-
12
-
13
-
14
-
15
-
16
-
17
-
18
-
19
-
20
-
21
-
22
-
23
-
24
-
25
-
26
-
27
-
28
-
29
-
30
-
31
-
32
-
33
-
34
-
35
-
36
-
37
-
38
-
39
-
40
-
41
-
42
-
43
-
44
-
45
-
46
-
47
-
48
-
49
-
 50
50 -
 51
51 -
 52
52 -
 53
53 -
 54
54 -
 55
55 -
 56
56 -
 57
57 -
 58
58 -
 59
59 -
 60
60 -
 61
61 -
 62
62 -
 63
63 -
 64
64 -
 65
65 -
 66
66 -
 67
67 -
 68
68 -
 69
69 -
 70
70 -
71
-
72
-
73
-
74
-
75
-
76
-
77
-
78
-
79
-
80
-
81
-
82
-
83
-
84
-
85
-
86
-
87
-
88
-
89
-
90
-
91
-
92
-
93
-
94
-
95
-
96
-
97
-
98
-
99
-
100
-
101
-
102
-
103
-
104
-
105
-
106
-
107
-
108
-
109
-
110
-
111
-
112
-
113
-
114
-
115
-
116
-
117
-
118
-
119
-
120
-
121
-
122
-
123
-
124
 |
 |

Notes to Consolidated Financial Statements (Continued)
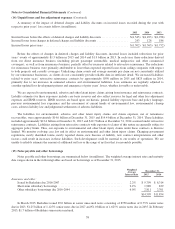
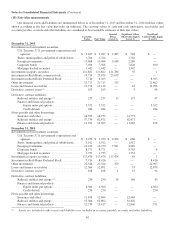
(14) Unpaid losses and loss adjustment expenses (Continued)
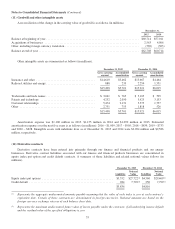
A summary of the impact of deferred charges and liability discounts on incurred losses recorded during the year with
respect to prior years’ loss events follows (in millions):
2015 2014 2013
Incurred losses before the effects of deferred charges and liability discounts .................. $(1,545) $(1,493) $(1,938)
Incurred losses from changes in deferred charges and liability discounts ..................... 243 128 186
Incurred losses prior years ......................................................... $(1,302) $(1,365) $(1,752)
Before the effects of changes in deferred charges and liability discounts, incurred losses included reductions for prior
years’ events of approximately $1.5 billion in 2015 and 2014 and $1.9 billion in 2013. In each year, these reductions derived
from our direct insurance business (including private passenger automobile, medical malpractice and other commercial
coverages), as well as from reinsurance business, partially offset by increases related to retroactive reinsurance. The reductions
for reinsurance business were primarily attributable to lower than expected reported losses from ceding companies with respect
to both property and casualty coverages. Underlying claim counts and average amounts per claim are not consistently utilized
by our reinsurance businesses, as clients do not consistently provide reliable data in sufficient detail. We increased liabilities
related to prior years’ retroactive reinsurance contracts by approximately $550 million in 2015 and $825 million in 2014,
primarily due to net increases in estimated asbestos and environmental liabilities. Loss estimates are regularly adjusted to
consider updated loss development patterns and emergence of prior years’ losses, whether favorable or unfavorable.
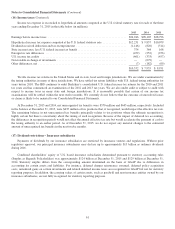
We are exposed to environmental, asbestos and other latent injury claims arising from insurance and reinsurance contracts.
Liability estimates for these exposures include case basis reserves and also reflect reserves for legal and other loss adjustment
expenses and IBNR reserves. IBNR reserves are based upon our historic general liability exposure base and policy language,
previous environmental loss experience and the assessment of current trends of environmental law, environmental cleanup
costs, asbestos liability law and judgmental settlements of asbestos liabilities.
The liabilities for environmental, asbestos and other latent injury claims and claims expenses, net of reinsurance
recoverables, were approximately $14.0 billion at December 31, 2015 and $14.4 billion at December 31, 2014. These liabilities
included approximately $12.4 billion at December 31, 2015 and $12.7 billion at December 31, 2014 assumed under retroactive
reinsurance contracts. Liabilities arising from retroactive contracts with exposure to claims of this nature are generally subject to
aggregate policy limits. Thus, our exposure to environmental and other latent injury claims under these contracts is likewise
limited. We monitor evolving case law and its effect on environmental and other latent injury claims. Changing government
regulations, newly identified toxins, newly reported claims, new theories of liability, new contract interpretations and other
factors could result in increases in these liabilities. Such development could be material to our results of operations. We are
unable to reliably estimate the amount of additional net loss or the range of net loss that is reasonably possible.
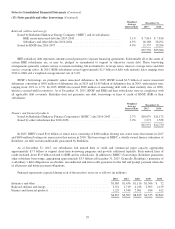
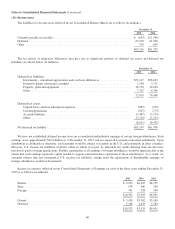
(15) Notes payable and other borrowings
Notes payable and other borrowings are summarized below (in millions). The weighted average interest rates and maturity
date ranges shown in the following tables are based on borrowings as of December 31, 2015.
Weighted
Average
Interest Rate
December 31,
2015 2014
Insurance and other:
Issued by Berkshire due 2016-2047 .......................................... 2.2% $ 9,799 $ 8,314
Short-term subsidiary borrowings ........................................... 2.2% 1,989 839
Other subsidiary borrowings due 2016-2044 ................................... 6.0% 2,811 2,701
$14,599 $11,854
In March 2015, Berkshire issued €3.0 billion in senior unsecured notes consisting of €750 million of 0.75% senior notes
due in 2023, €1.25 billion of 1.125% senior notes due in 2027 and €1.0 billion of 1.625% senior notes due in 2035. In February
2015, $1.7 billion of Berkshire senior notes matured.
58