Berkshire Hathaway 2015 Annual Report Download - page 86
Download and view the complete annual report
Please find page 86 of the 2015 Berkshire Hathaway annual report below. You can navigate through the pages in the report by either clicking on the pages listed below, or by using the keyword search tool below to find specific information within the annual report.-
 1
1 -
2
-
3
-
4
-
5
-
6
-
7
-
8
-
9
-
10
-
11
-
12
-
13
-
14
-
15
-
16
-
17
-
18
-
19
-
20
-
21
-
22
-
23
-
24
-
25
-
26
-
27
-
28
-
29
-
30
-
31
-
32
-
33
-
34
-
35
-
36
-
37
-
38
-
39
-
40
-
41
-
42
-
43
-
44
-
45
-
46
-
47
-
48
-
49
-
50
-
51
-
52
-
53
-
54
-
55
-
56
-
57
-
58
-
59
-
60
-
61
-
62
-
63
-
64
-
65
-
66
-
67
-
68
-
69
-
70
-
71
-
72
-
73
-
74
-
75
-
 76
76 -
 77
77 -
 78
78 -
 79
79 -
 80
80 -
 81
81 -
 82
82 -
 83
83 -
 84
84 -
 85
85 -
 86
86 -
 87
87 -
 88
88 -
 89
89 -
 90
90 -
 91
91 -
 92
92 -
 93
93 -
 94
94 -
 95
95 -
 96
96 -
97
-
98
-
99
-
100
-
101
-
102
-
103
-
104
-
105
-
106
-
107
-
108
-
109
-
110
-
111
-
112
-
113
-
114
-
115
-
116
-
117
-
118
-
119
-
120
-
121
-
122
-
123
-
124
 |
 |
Management’s Discussion and Analysis (Continued)
Railroad (“Burlington Northern Santa Fe”) (Continued)
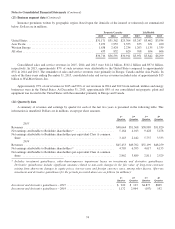
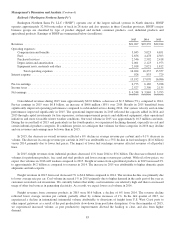
Operating expenses in 2015 were $14.3 billion, a decrease of $2 billion (12%) compared to 2014. In 2015, the ratio of
operating expenses to revenues declined 4.9 percentage points to 64.9% as compared to 2014. Compensation and benefits
expenses were relatively flat versus 2014. In response to weakening customer demand in the latter half of 2015, employment
levels were reduced. Fuel expenses in 2015 declined $1.8 billion (41%) compared to 2014, reflecting significantly lower
average fuel prices, improved efficiency and lower gross ton miles volume. In 2015, depreciation and amortization expense
decreased $122 million (6%) compared to 2014 as a result of lower capitalized software amortization expenses, partially offset
by increased depreciation expense attributable to increased levels of railroad assets in service.
Interest expense in 2015 was $928 million, an increase of $95 million (11%) compared to 2014. Interest expense in 2014
was $833 million, an increase of $104 million (14%) compared to 2013. BNSF funds its capital expenditures with cash flow
from operations and new debt issuances. In each period, the increased interest expense resulted from higher average outstanding
debt.
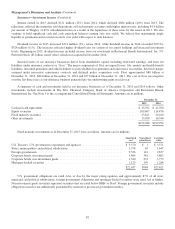
Consolidated revenues in 2014 were approximately $23.2 billion, representing an increase of $1.2 billion (5.6%) over
2013. The overall increase in revenues reflected a 1.8% increase in cars/units handled and a 3.5% increase in average revenue
per car/unit. In 2014, our combined volume was approximately 10.3 million cars/units.
Our rail operations were negatively affected by severe winter weather conditions during the first quarter of 2014,
particularly in the Northern U.S. service territory, and from various other service issues throughout 2014. These issues resulted
in slower average speeds on our system and negatively impacted volumes and revenues of each of our business groups. We
experienced improvement in operating performance and freight volumes over the fourth quarter of 2014.
Revenues from consumer products in 2014 were $7.0 billion, and were relatively unchanged from 2013. In 2014, unit
volume and average revenues per car were relatively flat versus 2013. In 2014, our international intermodal business volume
was negatively affected by congestion at U.S. West Coast ports. In 2014, revenues from industrial products increased $508
million (9%) to $6.2 billion. The increase was primarily due to increases in overall unit volume, and to a lesser extent, changes
in rates and product mix. Revenues from agricultural products in 2014 increased $584 million (16%) to approximately $4.2
billion. The increase was primarily attributable to increased volume, rates and product mix changes. Also, agricultural products
volume in 2013 was negatively affected by the drought conditions in 2012. In 2014, coal revenues of $5.0 billion were
essentially unchanged from 2013, as a 2% increase in year-to-date unit volume was offset by a 2% decline in average rates.
Operating expenses in 2014 were $16.2 billion, an increase of $880 million (6%) over 2013. A significant portion of this
increase was due to increased costs related to severe weather issues and service-related challenges. Compensation and benefits
expenses increased $372 million (8%) in 2014 as compared with 2013, primarily due to increased employment levels, and to a
lesser extent, wage inflation and higher overtime. Fuel expenses were relatively unchanged compared to 2013. The favorable
impact from lower average fuel prices was largely offset by higher volumes. Depreciation and amortization expense increased
$150 million (8%) as a result of additional assets in service. Equipment rents, materials and other expenses increased $209
million (12%) compared to 2013 as a result of higher crew transportation and other travel costs, and increased costs of utilities.
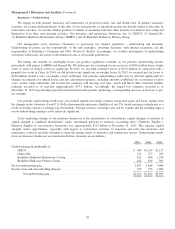
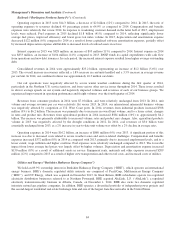
Utilities and Energy (“Berkshire Hathaway Energy Company”)
We hold an 89.9% ownership interest in Berkshire Hathaway Energy Company (“BHE”), which operates an international
energy business. BHE’s domestic regulated utility interests are comprised of PacifiCorp, MidAmerican Energy Company
(“MEC”), and NV Energy, which was acquired in December 2013. In Great Britain, BHE subsidiaries operate two regulated
electricity distribution businesses referred to as Northern Powergrid. BHE acquired AltaLink, L.P. (“AltaLink”), a regulated
electricity transmission-only business in Alberta, Canada, on December 1, 2014. BHE also owns two domestic regulated
interstate natural gas pipeline companies. In addition, BHE operates a diversified portfolio of independent power projects and
the second-largest residential real estate brokerage firm and one of the largest franchise networks in the United States.
84