Berkshire Hathaway 2015 Annual Report Download - page 15
Download and view the complete annual report
Please find page 15 of the 2015 Berkshire Hathaway annual report below. You can navigate through the pages in the report by either clicking on the pages listed below, or by using the keyword search tool below to find specific information within the annual report.-
 1
1 -
2
-
3
-
4
-
 5
5 -
 6
6 -
 7
7 -
 8
8 -
 9
9 -
 10
10 -
 11
11 -
 12
12 -
 13
13 -
 14
14 -
 15
15 -
 16
16 -
 17
17 -
 18
18 -
 19
19 -
 20
20 -
 21
21 -
 22
22 -
 23
23 -
 24
24 -
 25
25 -
26
-
27
-
28
-
29
-
30
-
31
-
32
-
33
-
34
-
35
-
36
-
37
-
38
-
39
-
40
-
41
-
42
-
43
-
44
-
45
-
46
-
47
-
48
-
49
-
50
-
51
-
52
-
53
-
54
-
55
-
56
-
57
-
58
-
59
-
60
-
61
-
62
-
63
-
64
-
65
-
66
-
67
-
68
-
69
-
70
-
71
-
72
-
73
-
74
-
75
-
76
-
77
-
78
-
79
-
80
-
81
-
82
-
83
-
84
-
85
-
86
-
87
-
88
-
89
-
90
-
91
-
92
-
93
-
94
-
95
-
96
-
97
-
98
-
99
-
100
-
101
-
102
-
103
-
104
-
105
-
106
-
107
-
108
-
109
-
110
-
111
-
112
-
113
-
114
-
115
-
116
-
117
-
118
-
119
-
120
-
121
-
122
-
123
-
124
 |
 |

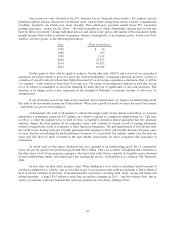
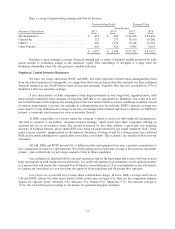
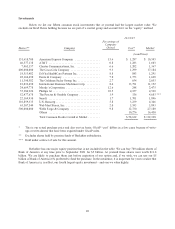
Here’s a recap of underwriting earnings and float by division:
Underwriting Profit Yearend Float
(in millions)
Insurance Operations 2015 2014 2015 2014
BH Reinsurance ............................... $ 421 $ 606 $44,108 $ 42,454
General Re ................................... 132 277 18,560 19,280
GEICO ...................................... 460 1,159 15,148 13,569
Other Primary ................................. 824 626 9,906 8,618
$ 1,837 $ 2,668 $ 87,722 $ 83,921
Berkshire’s great managers, premier financial strength and a variety of business models protected by wide
moats amount to something unique in the insurance world. This assemblage of strengths is a huge asset for
Berkshire shareholders that will only get more valuable with time.
Regulated, Capital-Intensive Businesses
We have two major operations, BNSF and BHE, that share important characteristics distinguishing them
from our other businesses. Consequently, we assign them their own section in this letter and split out their combined
financial statistics in our GAAP balance sheet and income statement. Together, they last year accounted for 37% of
Berkshire’s after-tax operating earnings.
A key characteristic of both companies is their huge investment in very long-lived, regulated assets, with
these partially funded by large amounts of long-term debt that is not guaranteed by Berkshire. Our credit is in fact
not needed because each company has earning power that even under terrible economic conditions would far exceed
its interest requirements. Last year, for example, in a disappointing year for railroads, BNSF’s interest coverage was
more than 8:1. (Our definition of coverage is the ratio of earnings before interest and taxes to interest, not EBITDA/
interest, a commonly used measure we view as seriously flawed.)
At BHE, meanwhile, two factors ensure the company’s ability to service its debt under all circumstances.
The first is common to all utilities: recession-resistant earnings, which result from these companies offering an
essential service on an exclusive basis. The second is enjoyed by few other utilities: a great and ever-widening
diversity of earnings streams, which shield BHE from being seriously harmed by any single regulatory body. These
many sources of profit, supplemented by the inherent advantage of being owned by a strong parent, have allowed
BHE and its utility subsidiaries to significantly lower their cost of debt. This economic fact benefits both us and our
customers.
All told, BHE and BNSF invested $11.6 billion in plant and equipment last year, a massive commitment to
key components of America’s infrastructure. We relish making such investments as long as they promise reasonable
returns – and, on that front, we put a large amount of trust in future regulation.
Our confidence is justified both by our past experience and by the knowledge that society will forever need
huge investments in both transportation and energy. It is in the self-interest of governments to treat capital providers
in a manner that will ensure the continued flow of funds to essential projects. It is concomitantly in our self-interest
to conduct our operations in a way that earns the approval of our regulators and the people they represent.
Low prices are a powerful way to keep these constituencies happy. In Iowa, BHE’s average retail rate is
6.8¢ per KWH. Alliant, the other major electric utility in the state, averages 9.5¢. Here are the comparable industry
figures for adjacent states: Nebraska 9.0¢, Missouri 9.3¢, Illinois 9.3¢, Minnesota 9.7¢. The national average is
10.4¢. Our rock-bottom prices add up to real money for paycheck-strapped customers.
13