Berkshire Hathaway 2015 Annual Report Download - page 79
Download and view the complete annual report
Please find page 79 of the 2015 Berkshire Hathaway annual report below. You can navigate through the pages in the report by either clicking on the pages listed below, or by using the keyword search tool below to find specific information within the annual report.-
 1
1 -
2
-
3
-
4
-
5
-
6
-
7
-
8
-
9
-
10
-
11
-
12
-
13
-
14
-
15
-
16
-
17
-
18
-
19
-
20
-
21
-
22
-
23
-
24
-
25
-
26
-
27
-
28
-
29
-
30
-
31
-
32
-
33
-
34
-
35
-
36
-
37
-
38
-
39
-
40
-
41
-
42
-
43
-
44
-
45
-
46
-
47
-
48
-
49
-
50
-
51
-
52
-
53
-
54
-
55
-
56
-
57
-
58
-
59
-
60
-
61
-
62
-
63
-
64
-
65
-
66
-
67
-
68
-
 69
69 -
 70
70 -
 71
71 -
 72
72 -
 73
73 -
 74
74 -
 75
75 -
 76
76 -
 77
77 -
 78
78 -
 79
79 -
 80
80 -
 81
81 -
 82
82 -
 83
83 -
 84
84 -
 85
85 -
 86
86 -
 87
87 -
 88
88 -
 89
89 -
90
-
91
-
92
-
93
-
94
-
95
-
96
-
97
-
98
-
99
-
100
-
101
-
102
-
103
-
104
-
105
-
106
-
107
-
108
-
109
-
110
-
111
-
112
-
113
-
114
-
115
-
116
-
117
-
118
-
119
-
120
-
121
-
122
-
123
-
124
 |
 |

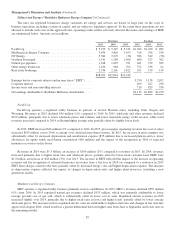
Management’s Discussion and Analysis (Continued)
Insurance—Underwriting (Continued)
GEICO
GEICO writes private passenger automobile insurance, offering coverages to insureds in all 50 states and the District of
Columbia. GEICO’s policies are marketed mainly by direct response methods in which customers apply for coverage directly to
the company via the Internet or over the telephone. This is a significant element in our strategy to be a low-cost auto insurer. In
addition, we strive to provide excellent service to customers, with the goal of establishing long-term customer relationships.
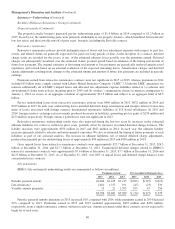
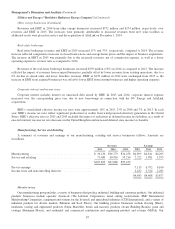
GEICO’s underwriting results are summarized below. Dollars are in millions.
2015 2014 2013
Amount % Amount % Amount %
Premiums written ........................................... $23,378 $20,962 $19,083
Premiums earned ............................................ $22,718 100.0 $20,496 100.0 $18,572 100.0
Losses and loss adjustment expenses ............................ 18,647 82.1 15,924 77.7 14,255 76.7
Underwriting expenses ....................................... 3,611 15.9 3,413 16.6 3,190 17.2
Total losses and expenses ..................................... 22,258 98.0 19,337 94.3 17,445 93.9
Pre-tax underwriting gain ..................................... $ 460 $ 1,159 $ 1,127
Premiums written and earned in 2015 increased 11.5% and 10.8%, respectively, over 2014. The increases in premiums
reflected growth in voluntary auto policies-in-force (5.4%) and rate increases. Voluntary auto new business sales in 2015
exceeded 2014 by about 1%. In 2015, our voluntary auto policies-in-force grew by 707,000 policies.
In 2015, pre-tax underwriting gains were $460 million compared to $1.16 billion in 2014 and $1.13 billion in 2013.
Throughout 2015, we experienced increases in claims frequencies and severities across all of our major coverages. Our loss
ratio, which is the ratio of losses and loss adjustment expenses incurred to premiums earned, in 2015 was 82.1% compared to
77.7% in 2014. As a result, we continue to implement premium rate increases where necessary.
Losses and loss adjustment expenses incurred in 2015 increased $2.7 billion (17.1%) over 2014. Claims frequencies (claim
counts per exposure unit) in 2015 increased in all major coverages over 2014, including property damage and collision
coverages (three to five percent range), bodily injury coverage (four to six percent range) and personal injury protection (PIP)
coverage (one to two percent range). Average claims severities were also higher in 2015 for property damage and collision
coverages (four to five percent range), bodily injury coverage (six to seven percent range) and PIP coverage (two to four percent
range). We believe that increases in miles driven, repair costs (parts and labor) and medical costs, as well as weather conditions
contributed to the increases in frequencies and severities.
Underwriting expenses in 2015 increased 5.8% to $3.6 billion. The largest components of underwriting expenses are
employee-related costs (salaries and benefits) and advertising. During 2015, these costs grew at a slower rate than premiums. As
a result, our expense ratio (the ratio of underwriting expenses to premiums earned) in 2015 declined 0.7 percentage points
compared to 2014.
Premiums written and earned in 2014 increased $1.88 billion (9.8%) and $1.92 billion (10.4%), respectively, compared to
premiums written and earned in 2013. These increases were attributable to an increase in voluntary auto policies-in-force of
6.6% and increased average premium per policy. Voluntary auto new business sales increased about 1.8% in 2014 as compared
to 2013 and voluntary auto policies-in-force increased 821,000 policies during 2014.
Losses and loss adjustment expenses incurred in 2014 increased $1.7 billion (11.7%) to $15.9 billion. In 2014, claims
frequencies for property damage and collision coverages increased in the three to four percent range over 2013, partially due to
more severe winter weather in the first quarter of 2014. Claims frequencies for bodily injury coverage increased about one
percent, while frequencies for personal injury protection decreased three to four percent. Physical damage severities increased
one to two percent in 2014 and bodily injury severities decreased in the one to two percent range from severities in 2013.
Overall, personal injury protection severities were relatively unchanged although we experienced relatively large, but offsetting,
changes by jurisdiction.
Underwriting expenses in 2014 increased $223 million (7.0%) to $3.4 billion. The increase reflected the increased policy
acquisition costs to generate the growth in policies-in-force and increased other operating expenses.
77