Berkshire Hathaway 2015 Annual Report Download - page 101
Download and view the complete annual report
Please find page 101 of the 2015 Berkshire Hathaway annual report below. You can navigate through the pages in the report by either clicking on the pages listed below, or by using the keyword search tool below to find specific information within the annual report.-
 1
1 -
2
-
3
-
4
-
5
-
6
-
7
-
8
-
9
-
10
-
11
-
12
-
13
-
14
-
15
-
16
-
17
-
18
-
19
-
20
-
21
-
22
-
23
-
24
-
25
-
26
-
27
-
28
-
29
-
30
-
31
-
32
-
33
-
34
-
35
-
36
-
37
-
38
-
39
-
40
-
41
-
42
-
43
-
44
-
45
-
46
-
47
-
48
-
49
-
50
-
51
-
52
-
53
-
54
-
55
-
56
-
57
-
58
-
59
-
60
-
61
-
62
-
63
-
64
-
65
-
66
-
67
-
68
-
69
-
70
-
71
-
72
-
73
-
74
-
75
-
76
-
77
-
78
-
79
-
80
-
81
-
82
-
83
-
84
-
85
-
86
-
87
-
88
-
89
-
90
-
 91
91 -
 92
92 -
 93
93 -
 94
94 -
 95
95 -
 96
96 -
 97
97 -
 98
98 -
 99
99 -
 100
100 -
 101
101 -
 102
102 -
 103
103 -
 104
104 -
 105
105 -
 106
106 -
 107
107 -
 108
108 -
 109
109 -
 110
110 -
 111
111 -
112
-
113
-
114
-
115
-
116
-
117
-
118
-
119
-
120
-
121
-
122
-
123
-
124
 |
 |

Management’s Discussion and Analysis (Continued)
Property and casualty losses (Continued)
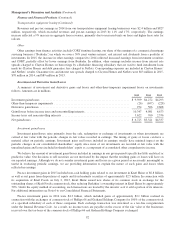
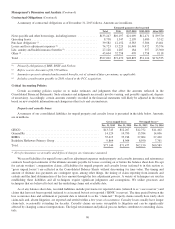
General Re
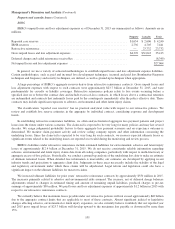
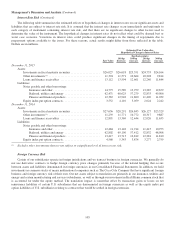
General Re’s gross and net unpaid losses and loss adjustment expenses and gross reserves by major line of business as of
December 31, 2015 are summarized below. Amounts are in millions.
Type Line of business
Reported case reserves ......................... $ 6,937 Workers’ compensation (1) ..................... $ 2,542
IBNR reserves ................................ 7,187 Auto liability ............................... 3,749
Gross unpaid losses and loss adjustment expenses .... 14,124 General liability and other casualty (2) ............ 4,230
Ceded reinsurance receivables and deferred charges . . (740) Mass tort-asbestos/environmental ............... 1,519
Net unpaid losses and loss adjustment expenses ...... $13,384 Property ................................... 2,084
Total ...................................... $14,124
(1) Net of discounts of $1,579 million.
(2) Includes directors and officers, errors and omissions, medical malpractice and umbrella coverage.
General Re’s loss reserve estimation process is based upon a ground-up approach, beginning with case loss estimates and
supplemented by additional case reserves (“ACRs”) and IBNR reserves. The critical processes involve the establishment of
ACRs by claim examiners, the determination of expected ultimate loss ratios which drive IBNR reserve amounts and the
comparison of incurred losses reporting trends to the expected loss reporting patterns by actuarial personnel. Recorded liabilities
are subject to “tail risk” where reported losses develop beyond the expected loss emergence time period.
We do not routinely determine loss reserve ranges. We believe that the techniques necessary to make such determinations
have not sufficiently developed to render meaningful estimates of such ranges.
Upon notification of a reinsurance claim from a ceding company, we independently evaluate loss amounts. In some cases,
our estimates differ from amounts reported by ceding companies. If our estimates are significantly greater than the ceding
company’s estimates, the claims are further investigated. If deemed appropriate, we establish ACRs above the amount reported
by the ceding company. As of December 31, 2015, ACRs aggregated approximately $2.4 billion before discounts and were
concentrated in workers’ compensation reserves, and to a lesser extent in professional liability reserves. We also periodically
conduct detailed claim reviews of individual clients and case reserves may be increased as a result.
We classify all loss and premium data into segments (“reserve cells”) primarily based on product (e.g., treaty, facultative
and program), line of business (e.g., auto liability, property and workers’ compensation) and jurisdiction. For each reserve cell,
premiums and losses are aggregated by accident year, policy year or underwriting year and analyzed over time. We internally
refer to these loss aggregations as loss triangles, which serve as the basis for our IBNR reserve calculations. Globally, we
review approximately 1,200 reserve cells.
We use loss triangles to determine the expected case loss emergence and development patterns for most coverages and, in
conjunction with expected loss ratios by accident, policy or underwriting year, we calculate IBNR reserves. In instances where
the historical loss data is insufficient, we may use loss emergence estimation formulae along with other loss triangles and
actuarial judgment to determine loss emergence patterns. Factors affecting our loss development triangles include, but are not
limited to, changes in the following: client claims practices; our use of ACRs or the frequency of client company claim reviews;
policy terms and coverage (such as client loss retention levels and occurrence and aggregate policy limits); loss trends, and legal
trends that result in unanticipated losses. Collectively, these factors influence the selection of the expected loss emergence
patterns.
We select expected loss ratios by reserve cell and by accident, policy or underwriting year based upon indicated ultimate
loss ratios and forecasted losses obtained from aggregated pricing statistics. Indicated ultimate loss ratios are determined from
the selected loss emergence pattern, reported losses and earned premiums. If the selected loss emergence pattern proves to be
unreasonable, then the indicated ultimate loss ratios may be unreasonable, which can then impact the selected loss ratios and the
IBNR reserve. Judgment is necessary in the analysis of indicated ultimate loss ratios and pricing statistics.
99