Berkshire Hathaway 2015 Annual Report Download - page 87
Download and view the complete annual report
Please find page 87 of the 2015 Berkshire Hathaway annual report below. You can navigate through the pages in the report by either clicking on the pages listed below, or by using the keyword search tool below to find specific information within the annual report.-
 1
1 -
2
-
3
-
4
-
5
-
6
-
7
-
8
-
9
-
10
-
11
-
12
-
13
-
14
-
15
-
16
-
17
-
18
-
19
-
20
-
21
-
22
-
23
-
24
-
25
-
26
-
27
-
28
-
29
-
30
-
31
-
32
-
33
-
34
-
35
-
36
-
37
-
38
-
39
-
40
-
41
-
42
-
43
-
44
-
45
-
46
-
47
-
48
-
49
-
50
-
51
-
52
-
53
-
54
-
55
-
56
-
57
-
58
-
59
-
60
-
61
-
62
-
63
-
64
-
65
-
66
-
67
-
68
-
69
-
70
-
71
-
72
-
73
-
74
-
75
-
76
-
 77
77 -
 78
78 -
 79
79 -
 80
80 -
 81
81 -
 82
82 -
 83
83 -
 84
84 -
 85
85 -
 86
86 -
 87
87 -
 88
88 -
 89
89 -
 90
90 -
 91
91 -
 92
92 -
 93
93 -
 94
94 -
 95
95 -
 96
96 -
 97
97 -
98
-
99
-
100
-
101
-
102
-
103
-
104
-
105
-
106
-
107
-
108
-
109
-
110
-
111
-
112
-
113
-
114
-
115
-
116
-
117
-
118
-
119
-
120
-
121
-
122
-
123
-
124
 |
 |

Management’s Discussion and Analysis (Continued)
Utilities and Energy (“Berkshire Hathaway Energy Company”) (Continued)
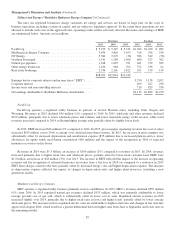
The rates our regulated businesses charge customers for energy and services are based, in large part, on the costs of
business operations, including a return on capital, and are subject to regulatory approval. To the extent these operations are not
allowed to include such costs in the approved rates, operating results will be adversely affected. Revenues and earnings of BHE
are summarized below. Amounts are in millions.
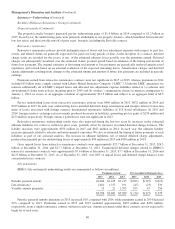
Revenues Earnings
2015 2014 2013 2015 2014 2013
PacifiCorp .............................................. $ 5,279 $ 5,315 $ 5,215 $1,026 $1,010 $ 982
MidAmerican Energy Company ............................. 3,459 3,818 3,453 314 298 230
NV Energy .............................................. 3,382 3,279 (36) 586 549 (58)
Northern Powergrid ....................................... 1,141 1,284 1,026 460 527 362
Natural gas pipelines ...................................... 1,018 1,093 971 401 379 385
Other energy businesses ................................... 1,416 664 292 372 236 62
Real estate brokerage ..................................... 2,536 2,161 1,822 191 139 139
$18,231 $17,614 $12,743
Earnings before corporate interest and income taxes (“EBIT”) ..... 3,350 3,138 2,102
Corporate interest ........................................ 499 427 296
Income taxes and noncontrolling interests ..................... 719 829 336
Net earnings attributable to Berkshire Hathaway shareholders ..... $2,132 $1,882 $1,470
PacifiCorp
PacifiCorp operates a regulated utility business in portions of several Western states, including Utah, Oregon and
Wyoming. Revenues in 2015 declined $36 million (1%) compared to 2014. In 2015, wholesale and other revenues declined
$129 million, principally due to lower wholesale prices and volumes and lower renewable energy credit revenue, while retail
revenues increased compared to 2014, reflecting higher average rates partially offset by slightly lower loads.
In 2015, EBIT increased $16 million (2%) compared to 2014. In 2015, gross margins (operating revenues less cost of sales)
increased $109 million versus 2014, as energy costs declined more than revenues. In 2015, the increase in gross margins was
substantially offset by increased depreciation and amortization expense ($35 million) due to increased plant-in-service, lower
allowances for equity funds used during construction ($18 million) and the impact of the recognition in 2014 of expected
insurance recoveries on fire losses.
Revenues in 2014 were $5.3 billion, an increase of $100 million (2%) compared to revenues in 2013. In 2014, revenues
increased primarily due to higher retail rates and wholesale prices, partially offset by lower retail customer load. EBIT were
$1.0 billion, an increase of $28 million (3%) over 2013. The increase in EBIT reflected the impact of the increase in operating
revenues and the recognition of estimated insurance recoveries from a fire loss in 2014 (as compared to a reduction in 2013
EBIT from charges related to the fire), partially offset by increased energy costs and higher depreciation expense. The increase
in depreciation expense reflected the impact of changes in depreciation rates and higher plant-in-service, including a new
generation facility.
MidAmerican Energy Company
MEC operates a regulated utility business primarily in Iowa and Illinois. In 2015, MEC’s revenues declined $359 million
(9%) from 2014. In 2015 regulated natural gas revenues declined $335 million, which was primarily attributable to lower
average per-unit cost of gas sold, which is substantially offset in lower cost of sales. Regulated electric revenues in 2015
increased slightly over 2014, primarily due to higher retail rates in Iowa and higher loads, partially offset by lower average
wholesale prices. The increases in Iowa regulated electric rates are attributable to higher retail rates and changes in rate structure
approved in August 2014, which results in a greater differential between higher rates from June to September and lower rates in
the remaining months.
85