Berkshire Hathaway 2015 Annual Report Download - page 5
Download and view the complete annual report
Please find page 5 of the 2015 Berkshire Hathaway annual report below. You can navigate through the pages in the report by either clicking on the pages listed below, or by using the keyword search tool below to find specific information within the annual report.-
 1
1 -
 2
2 -
 3
3 -
 4
4 -
 5
5 -
 6
6 -
 7
7 -
 8
8 -
 9
9 -
 10
10 -
 11
11 -
 12
12 -
 13
13 -
 14
14 -
 15
15 -
 16
16 -
17
-
18
-
19
-
20
-
21
-
22
-
23
-
24
-
25
-
26
-
27
-
28
-
29
-
30
-
31
-
32
-
33
-
34
-
35
-
36
-
37
-
38
-
39
-
40
-
41
-
42
-
43
-
44
-
45
-
46
-
47
-
48
-
49
-
50
-
51
-
52
-
53
-
54
-
55
-
56
-
57
-
58
-
59
-
60
-
61
-
62
-
63
-
64
-
65
-
66
-
67
-
68
-
69
-
70
-
71
-
72
-
73
-
74
-
75
-
76
-
77
-
78
-
79
-
80
-
81
-
82
-
83
-
84
-
85
-
86
-
87
-
88
-
89
-
90
-
91
-
92
-
93
-
94
-
95
-
96
-
97
-
98
-
99
-
100
-
101
-
102
-
103
-
104
-
105
-
106
-
107
-
108
-
109
-
110
-
111
-
112
-
113
-
114
-
115
-
116
-
117
-
118
-
119
-
120
-
121
-
122
-
123
-
124
 |
 |
BERKSHIRE HATHAWAY INC.
To the Shareholders of Berkshire Hathaway Inc.:
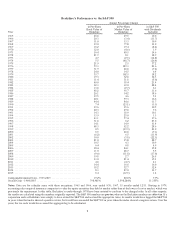
Berkshire’s gain in net worth during 2015 was $15.4 billion, which increased the per-share book value of
both our Class A and Class B stock by 6.4%. Over the last 51 years (that is, since present management took over),
per-share book value has grown from $19 to $155,501, a rate of 19.2% compounded annually.*
During the first half of those years, Berkshire’s net worth was roughly equal to the number that really
counts: the intrinsic value of the business. The similarity of the two figures existed then because most of our
resources were deployed in marketable securities that were regularly revalued to their quoted prices (less the tax that
would be incurred if they were to be sold). In Wall Street parlance, our balance sheet was then in very large part
“marked to market.”
By the early 1990s, however, our focus had changed to the outright ownership of businesses, a shift that
diminished the relevance of balance-sheet figures. That disconnect occurred because the accounting rules that apply
to controlled companies are materially different from those used in valuing marketable securities. The carrying
value of the “losers” we own is written down, but “winners” are never revalued upwards.
We’ve had experience with both outcomes: I’ve made some dumb purchases, and the amount I paid for the
economic goodwill of those companies was later written off, a move that reduced Berkshire’s book value. We’ve
also had some winners – a few of them very big – but have not written those up by a penny.
Over time, this asymmetrical accounting treatment (with which we agree) necessarily widens the gap
between intrinsic value and book value. Today, the large – and growing – unrecorded gains at our “winners” make it
clear that Berkshire’s intrinsic value far exceeds its book value. That’s why we would be delighted to repurchase
our shares should they sell as low as 120% of book value. At that level, purchases would instantly and meaningfully
increase per-share intrinsic value for Berkshire’s continuing shareholders.
The unrecorded increase in the value of our owned businesses explains why Berkshire’s aggregate market-
value gain – tabulated on the facing page – materially exceeds our book-value gain. The two indicators vary
erratically over short periods. Last year, for example, book-value performance was superior. Over time, however,
market-value gains should continue their historical tendency to exceed gains in book value.
* All per-share figures used in this report apply to Berkshire’s A shares. Figures for the B shares are 1/1500th of
those shown for A.
3