Berkshire Hathaway 2015 Annual Report Download - page 22
Download and view the complete annual report
Please find page 22 of the 2015 Berkshire Hathaway annual report below. You can navigate through the pages in the report by either clicking on the pages listed below, or by using the keyword search tool below to find specific information within the annual report.-
 1
1 -
2
-
3
-
4
-
5
-
6
-
7
-
8
-
9
-
10
-
11
-
 12
12 -
 13
13 -
 14
14 -
 15
15 -
 16
16 -
 17
17 -
 18
18 -
 19
19 -
 20
20 -
 21
21 -
 22
22 -
 23
23 -
 24
24 -
 25
25 -
 26
26 -
 27
27 -
 28
28 -
 29
29 -
 30
30 -
 31
31 -
 32
32 -
33
-
34
-
35
-
36
-
37
-
38
-
39
-
40
-
41
-
42
-
43
-
44
-
45
-
46
-
47
-
48
-
49
-
50
-
51
-
52
-
53
-
54
-
55
-
56
-
57
-
58
-
59
-
60
-
61
-
62
-
63
-
64
-
65
-
66
-
67
-
68
-
69
-
70
-
71
-
72
-
73
-
74
-
75
-
76
-
77
-
78
-
79
-
80
-
81
-
82
-
83
-
84
-
85
-
86
-
87
-
88
-
89
-
90
-
91
-
92
-
93
-
94
-
95
-
96
-
97
-
98
-
99
-
100
-
101
-
102
-
103
-
104
-
105
-
106
-
107
-
108
-
109
-
110
-
111
-
112
-
113
-
114
-
115
-
116
-
117
-
118
-
119
-
120
-
121
-
122
-
123
-
124
 |
 |

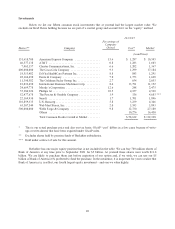
Investments
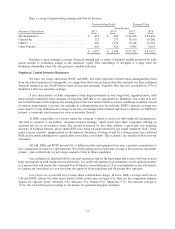
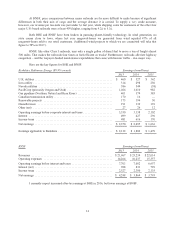
Below we list our fifteen common stock investments that at yearend had the largest market value. We
exclude our Kraft Heinz holding because we are part of a control group and account for it on the “equity” method.
12/31/15
Shares** Company
Percentage of
Company
Owned Cost* Market
(in millions)
151,610,700 American Express Company ................. 15.6 $ 1,287 $ 10,545
46,577,138 AT&T ................................... 0.8 1,283 1,603
7,463,157 Charter Communications, Inc. ................ 6.6 1,202 1,367
400,000,000 The Coca-Cola Company .................... 9.3 1,299 17,184
18,513,482 DaVita HealthCare Partners Inc. .............. 8.8 843 1,291
22,164,450 Deere & Company ......................... 7.0 1,773 1,690
11,390,582 The Goldman Sachs Group, Inc. ............... 2.7 654 2,053
81,033,450 International Business Machines Corp. ......... 8.4 13,791 11,152
24,669,778 Moody’s Corporation ....................... 12.6 248 2,475
55,384,926 Phillips 66 ................................ 10.5 4,357 4,530
52,477,678 The Procter & Gamble Company .............. 1.9 336 4,683 ***
22,169,930 Sanofi ................................... 1.7 1,701 1,896
101,859,335 U.S. Bancorp .............................. 5.8 3,239 4,346
63,507,544 Wal-Mart Stores, Inc. ....................... 2.0 3,593 3,893
500,000,000 Wells Fargo & Company .................... 9.8 12,730 27,180
Others ................................... 10,276 16,450
Total Common Stocks Carried at Market ........ $58,612 $ 112,338
* This is our actual purchase price and also our tax basis; GAAP “cost” differs in a few cases because of write-
ups or write-downs that have been required under GAAP rules.
** Excludes shares held by pension funds of Berkshire subsidiaries.
*** Held under contract of sale for this amount.
Berkshire has one major equity position that is not included in the table: We can buy 700 million shares of
Bank of America at any time prior to September 2021 for $5 billion. At yearend these shares were worth $11.8
billion. We are likely to purchase them just before expiration of our option and, if we wish, we can use our $5
billion of Bank of America 6% preferred to fund the purchase. In the meantime, it is important for you to realize that
Bank of America is, in effect, our fourth largest equity investment – and one we value highly.
20