Berkshire Hathaway 2015 Annual Report Download - page 11
Download and view the complete annual report
Please find page 11 of the 2015 Berkshire Hathaway annual report below. You can navigate through the pages in the report by either clicking on the pages listed below, or by using the keyword search tool below to find specific information within the annual report.Intrinsic Business Value
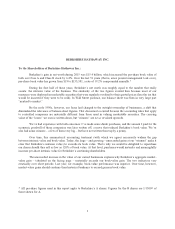
As much as Charlie and I talk about intrinsic business value, we cannot tell you precisely what that number
is for Berkshire shares (nor, in fact, for any other stock). It is possible, however, to make a sensible estimate. In our
2010 annual report we laid out the three elements – one of them qualitative – that we believe are the keys to an
estimation of Berkshire’s intrinsic value. That discussion is reproduced in full on pages 113-114.
Here is an update of the two quantitative factors: In 2015 our per-share cash and investments increased
8.3% to $159,794 (with our Kraft Heinz shares stated at market value), and earnings from our many businesses –
including insurance underwriting income – increased 2.1% to $12,304 per share. We exclude in the second factor
the dividends and interest from the investments we hold because including them would produce a double-counting
of value. In arriving at our earnings figure, we deduct all corporate overhead, interest, depreciation, amortization
and minority interests. Income taxes, though, are not deducted. That is, the earnings are pre-tax.
I used the italics in the paragraph above because we are for the first time including insurance underwriting
income in business earnings. We did not do that when we initially introduced Berkshire’s two quantitative pillars of
valuation because our insurance results were then heavily influenced by catastrophe coverages. If the wind didn’t
blow and the earth didn’t shake, we made large profits. But a mega-catastrophe would produce red ink. In order to
be conservative then in stating our business earnings, we consistently assumed that underwriting would break even
over time and ignored any of its gains or losses in our annual calculation of the second factor of value.
Today, our insurance results are likely to be more stable than was the case a decade or two ago because we
have deemphasized catastrophe coverages and greatly expanded our bread-and-butter lines of business. Last year,
our underwriting income contributed $1,118 per share to the $12,304 per share of earnings referenced in the second
paragraph of this section. Over the past decade, annual underwriting income has averaged $1,434 per share, and we
anticipate being profitable in most years. You should recognize, however, that underwriting in any given year could
well be unprofitable, perhaps substantially so.
Since 1970, our per-share investments have increased at a rate of 18.9% compounded annually, and our
earnings (including the underwriting results in both the initial and terminal year) have grown at a 23.7% clip. It is no
coincidence that the price of Berkshire stock over the ensuing 45 years has increased at a rate very similar to that of
our two measures of value. Charlie and I like to see gains in both sectors, but our main goal is to build operating
earnings.
************
Now, let’s examine the four major sectors of our operations. Each has vastly different balance sheet and
income characteristics from the others. So we’ll present them as four separate businesses, which is how Charlie and
I view them (though there are important and enduring economic advantages to having them all under one roof). Our
intent is to provide you with the information we would wish to have if our positions were reversed, with you being
the reporting manager and we the absentee shareholders. (Don’t get excited; this is not a switch we are considering.)
Insurance
Let’s look first at insurance. The property-casualty (“P/C”) branch of that industry has been the engine that
has propelled our expansion since 1967, when we acquired National Indemnity and its sister company, National
Fire & Marine, for $8.6 million. Today, National Indemnity is the largest property-casualty company in the world,
as measured by net worth. Moreover, its intrinsic value is far in excess of the value at which it is carried on our
books.
9

