Berkshire Hathaway 2015 Annual Report Download - page 88
Download and view the complete annual report
Please find page 88 of the 2015 Berkshire Hathaway annual report below. You can navigate through the pages in the report by either clicking on the pages listed below, or by using the keyword search tool below to find specific information within the annual report.-
 1
1 -
2
-
3
-
4
-
5
-
6
-
7
-
8
-
9
-
10
-
11
-
12
-
13
-
14
-
15
-
16
-
17
-
18
-
19
-
20
-
21
-
22
-
23
-
24
-
25
-
26
-
27
-
28
-
29
-
30
-
31
-
32
-
33
-
34
-
35
-
36
-
37
-
38
-
39
-
40
-
41
-
42
-
43
-
44
-
45
-
46
-
47
-
48
-
49
-
50
-
51
-
52
-
53
-
54
-
55
-
56
-
57
-
58
-
59
-
60
-
61
-
62
-
63
-
64
-
65
-
66
-
67
-
68
-
69
-
70
-
71
-
72
-
73
-
74
-
75
-
76
-
77
-
 78
78 -
 79
79 -
 80
80 -
 81
81 -
 82
82 -
 83
83 -
 84
84 -
 85
85 -
 86
86 -
 87
87 -
 88
88 -
 89
89 -
 90
90 -
 91
91 -
 92
92 -
 93
93 -
 94
94 -
 95
95 -
 96
96 -
 97
97 -
 98
98 -
99
-
100
-
101
-
102
-
103
-
104
-
105
-
106
-
107
-
108
-
109
-
110
-
111
-
112
-
113
-
114
-
115
-
116
-
117
-
118
-
119
-
120
-
121
-
122
-
123
-
124
 |
 |
Management’s Discussion and Analysis (Continued)
Utilities and Energy (“Berkshire Hathaway Energy Company”) (Continued)
MidAmerican Energy Company (Continued)
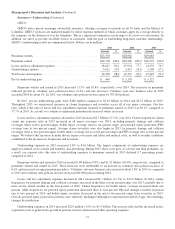
MEC’s EBIT in 2015 increased $16 million (5%) compared to 2014, reflecting an increase in gross margins ($97 million),
partially offset by increases in depreciation expense from new wind generation and other plant-in-service ($56 million), interest
expense ($17 million), and lower allowances for equity funds used during construction ($19 million). The increase in gross
margins derived primarily from the regulated electric business, which benefitted from the aforementioned changes in Iowa rates
and rate structure and lower fuel and purchased power costs.
Revenues in 2014 increased $365 million (11%) to $3.8 billion, reflecting increases from regulated natural gas ($172 million),
regulated electric ($55 million) and nonregulated revenues ($122 million). The increase in regulated natural gas revenues was
driven by higher per-unit natural gas costs, which are recovered from customers via adjustment clauses, and higher volume. The
increase in regulated electric revenues was primarily due to increased retail rates. The increase in nonregulated revenues was due to
higher natural gas and electricity prices and higher electricity volumes, partly offset by lower natural gas volumes. EBIT were $298
million in 2014, an increase of $68 million (30%) compared to 2013. The comparative increase in EBIT was primarily due to
increased earnings from the regulated electric business, reflecting the impact of higher revenues and lower depreciation and
amortization expense due to the impact of depreciation rate changes, partially offset by increased energy and operating costs.
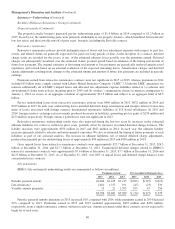
NV Energy
BHE acquired NV Energy on December 19, 2013, and its results are included in our consolidated results beginning as of
that date. NV Energy operates electric and natural gas utilities in Nevada. Revenues and EBIT in 2015 were $3.4 billion and
$586 million, respectively, representing increases of $103 million (3%) and $37 million (7%), respectively, over 2014. The
increase in revenues was due primarily to higher retail electric revenues reflecting increased customers and higher loads. The
increase in EBIT was attributable to an increase in gross margins ($82 million) and lower interest expense ($22 million),
partially offset by increased depreciation and amortization ($31 million) and higher other operating expenses, including
increased energy efficiency costs. For the December 19 through December 31, 2013 period, NV Energy’s results reflected one-
time customer refunds, acquisition costs and other charges arising from the acquisition.
Northern Powergrid
Revenues in 2015 declined $143 million (11%) versus 2014, reflecting the adverse impact of the stronger U.S. Dollar ($90
million) and comparatively lower distribution revenues. The decline in distribution revenues reflected lower rates due mainly to
the new price control period effective April 1, 2015. In 2015, EBIT declined $67 million (13%) compared to 2014, reflecting the
adverse effects of the stronger U.S. Dollar and lower distribution revenues partially offset by lower interest expense ($13
million).
Revenues in 2014 increased $258 million (25%) and EBIT increased $165 million (46%) as compared to 2013. The
increases were due mainly to increased distribution revenues in 2014 from increased rates and favorable regulatory provisions
and from the impact of the weaker U.S. Dollar.
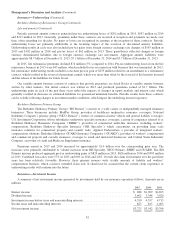
Natural Gas Pipelines
Revenues in 2015 declined $75 million (7%) versus 2014, which was primarily due to lower gas sales as a result of reduced
system and operational balancing activities, partially offset by higher transportation revenues. In 2015, EBIT increased $22 million
(6%) as compared to 2014, as decreased costs of gas sold and lower operating expenses more than offset the decline in revenues.
Revenues in 2014 increased $122 million (13%) compared to 2013. The increase reflected comparatively higher natural gas
rates and volumes as a result of significantly colder weather conditions in the first quarter of 2014 in one of our pipeline company’s
service territory and system rebalancing activities. EBIT in 2014 of $379 million were relatively unchanged from 2013, as the
impact of higher revenues was offset by increased costs of gas sold, and higher system inspection, testing and maintenance costs.
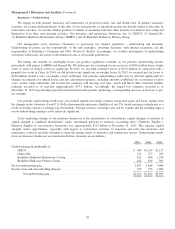
Other energy businesses
Revenues of other energy businesses in 2015 increased $752 million (113%) over revenues in 2014, while EBIT increased
$136 million (58%) versus 2014. Revenues and EBIT in 2015 reflect the acquisition of AltaLink on December 1, 2014.
AltaLink’s revenues and EBIT in 2015 were $621 million and $170 million, respectively. The remaining increase in revenues
was primarily due to an increase in solar capacity placed in service. Excluding the acquisition of AltaLink, the impact of higher
revenues in 2015 was more than offset by higher operating, depreciation and interest expenses.
86