Berkshire Hathaway 2015 Annual Report Download - page 91
Download and view the complete annual report
Please find page 91 of the 2015 Berkshire Hathaway annual report below. You can navigate through the pages in the report by either clicking on the pages listed below, or by using the keyword search tool below to find specific information within the annual report.-
 1
1 -
2
-
3
-
4
-
5
-
6
-
7
-
8
-
9
-
10
-
11
-
12
-
13
-
14
-
15
-
16
-
17
-
18
-
19
-
20
-
21
-
22
-
23
-
24
-
25
-
26
-
27
-
28
-
29
-
30
-
31
-
32
-
33
-
34
-
35
-
36
-
37
-
38
-
39
-
40
-
41
-
42
-
43
-
44
-
45
-
46
-
47
-
48
-
49
-
50
-
51
-
52
-
53
-
54
-
55
-
56
-
57
-
58
-
59
-
60
-
61
-
62
-
63
-
64
-
65
-
66
-
67
-
68
-
69
-
70
-
71
-
72
-
73
-
74
-
75
-
76
-
77
-
78
-
79
-
80
-
 81
81 -
 82
82 -
 83
83 -
 84
84 -
 85
85 -
 86
86 -
 87
87 -
 88
88 -
 89
89 -
 90
90 -
 91
91 -
 92
92 -
 93
93 -
 94
94 -
 95
95 -
 96
96 -
 97
97 -
 98
98 -
 99
99 -
 100
100 -
 101
101 -
102
-
103
-
104
-
105
-
106
-
107
-
108
-
109
-
110
-
111
-
112
-
113
-
114
-
115
-
116
-
117
-
118
-
119
-
120
-
121
-
122
-
123
-
124
 |
 |

Management’s Discussion and Analysis (Continued)
Manufacturing, Service and Retailing (Continued)
Building products (Continued)
Revenues in 2014 were approximately $10.1 billion, an increase of 5% over 2013. Johns Manville, Acme and MiTek
produced revenue increases, which were primarily due to higher sales volume, as well as from the impact of bolt-on acquisitions
($150 million). Shaw’s revenues in 2014 were relatively unchanged from 2013, reflecting the impact of the closure of the rugs
division in early 2014 and lower carpet sales, offset by higher sales of hard surface flooring products. Pre-tax earnings of the
building products businesses increased 6% in 2014 as compared to 2013. With the exception of Shaw, our building products
businesses generated increased earnings compared to 2013. Shaw’s earnings were lower due to comparatively higher raw
material costs.
Consumer products
Revenues of our consumer products manufacturers were approximately $9.1 billion in 2015, relatively unchanged from
2014. In 2015, Forest River’s revenues increased $217 million (6%) over 2014, due to a 4% increase in unit sales and increased
average prices. Apparel revenues declined $157 million (4%) compared to 2014. In 2015, the decline in apparel revenues was
attributable to generally lower sales volumes compared to 2014 and the negative impact of foreign currency translation as a
result of a stronger U.S. Dollar ($113 million).
Pre-tax earnings declined $24 million in 2015 (3%) compared to 2014. The decline was primarily due to a pre-tax loss in
2015 from the disposition of an unprofitable operation within Fruit of the Loom and lower earnings from our footwear
businesses, partially offset by higher earnings from Forest River.
Revenues were $9.0 billion in 2014, an increase of $474 million (6%) compared to 2013. The increase was driven by a
14% increase in Forest River’s revenues due to increased unit sales. Pre-tax earnings were $756 million in 2014, an increase of
$174 million (30%) compared to 2013. The increase was primarily due to higher earnings from apparel businesses, and to a
lesser extent, Forest River. Operating results of our apparel businesses benefitted from restructuring initiatives undertaken
beginning in 2013, which included discontinuing unprofitable business, as well as from comparatively lower manufacturing and
pension costs. The increase in Forest River’s earnings reflected the aforementioned increase in unit sales and lower unit
manufacturing costs.
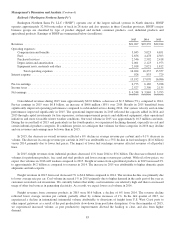
Service and retailing
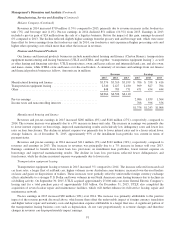
Our service and retailing businesses are comprised of a large group of independently managed businesses engaged in a
variety of activities. A summary of revenues and pre-tax earnings of these operations follows (in millions).
Revenues Pre-tax earnings
2015 2014 2013 2015 2014 2013
Service ................................................. $10,201 $ 9,854 $ 8,996 $1,156 $1,202 $1,093
Retailing ............................................... 13,265 4,422 4,288 564 344 376
McLane Company ........................................ 48,223 46,640 45,930 502 435 486
$71,689 $60,916 $59,214 $2,222 $1,981 $1,955
Service
Our service businesses offer fractional ownership programs for general aviation aircraft (NetJets) and high technology
training to operators of aircraft (FlightSafety). We also distribute electronic components (TTI) and provide electronic
distribution services of corporate news, multimedia and regulatory filings (Business Wire). We franchise and service quick
service restaurants (Dairy Queen) and publish newspapers and other publications (Buffalo News and the BH Media Group). In
June 2014, we acquired a television station operating in Miami, Florida (WPLG) and in December 2014, we acquired a third
party logistics services business that primarily serves the petroleum and chemical industries (Charter Brokerage).
Revenues in 2015 increased $347 million (3.5%) as compared to 2014. The increase in revenues included a 5% increase in
NetJets’ revenues and the impact of the acquisitions of Charter Brokerage and WPLG, partly offset by lower revenues from our
newspapers. The increase in NetJets’ revenues was attributable to a 50% increase in aircraft sales, partially offset by lower
operations revenue due primarily to lower fuel cost recoveries ($189 million) and unfavorable foreign currency effects ($105
million).
89