Berkshire Hathaway 2015 Annual Report Download - page 42
Download and view the complete annual report
Please find page 42 of the 2015 Berkshire Hathaway annual report below. You can navigate through the pages in the report by either clicking on the pages listed below, or by using the keyword search tool below to find specific information within the annual report.-
 1
1 -
2
-
3
-
4
-
5
-
6
-
7
-
8
-
9
-
10
-
11
-
12
-
13
-
14
-
15
-
16
-
17
-
18
-
19
-
20
-
21
-
22
-
23
-
24
-
25
-
26
-
27
-
28
-
29
-
30
-
31
-
 32
32 -
 33
33 -
 34
34 -
 35
35 -
 36
36 -
 37
37 -
 38
38 -
 39
39 -
 40
40 -
 41
41 -
 42
42 -
 43
43 -
 44
44 -
 45
45 -
 46
46 -
 47
47 -
 48
48 -
 49
49 -
 50
50 -
 51
51 -
 52
52 -
53
-
54
-
55
-
56
-
57
-
58
-
59
-
60
-
61
-
62
-
63
-
64
-
65
-
66
-
67
-
68
-
69
-
70
-
71
-
72
-
73
-
74
-
75
-
76
-
77
-
78
-
79
-
80
-
81
-
82
-
83
-
84
-
85
-
86
-
87
-
88
-
89
-
90
-
91
-
92
-
93
-
94
-
95
-
96
-
97
-
98
-
99
-
100
-
101
-
102
-
103
-
104
-
105
-
106
-
107
-
108
-
109
-
110
-
111
-
112
-
113
-
114
-
115
-
116
-
117
-
118
-
119
-
120
-
121
-
122
-
123
-
124
 |
 |

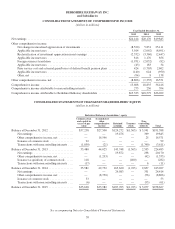
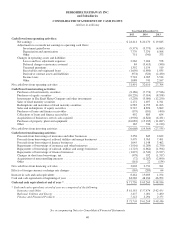
BERKSHIRE HATHAWAY INC.
and Subsidiaries
CONSOLIDATED STATEMENTS OF CASH FLOWS
(dollars in millions)
Year Ended December 31,
2015 2014 2013
Cash flows from operating activities:
Net earnings ................................................................ $24,414 $ 20,170 $ 19,845
Adjustments to reconcile net earnings to operating cash flows:
Investment gains/losses ................................................... (9,373) (3,575) (4,065)
Depreciation and amortization ............................................. 7,779 7,370 6,508
Other ................................................................. 751 (341) 373
Changes in operating assets and liabilities:
Losses and loss adjustment expenses ........................................ 2,262 7,404 578
Deferred charges reinsurance assumed ....................................... 84 (3,413) (340)
Unearned premiums ...................................................... 1,392 1,159 519
Receivables and originated loans ........................................... (1,650) (1,890) 1,035
Derivative contract assets and liabilities ...................................... (974) (520) (2,430)
Income taxes ........................................................... 5,718 4,905 3,514
Other ................................................................. 1,088 741 2,167
Net cash flows from operating activities .............................................. 31,491 32,010 27,704
Cash flows from investing activities:
Purchases of fixed maturity securities ............................................ (8,186) (7,774) (7,546)
Purchases of equity securities .................................................. (10,220) (7,014) (8,558)
Investments in The Kraft Heinz Company and other investments ...................... (5,258) (3,000) (12,250)
Sales of fixed maturity securities ............................................... 2,172 1,697 4,311
Redemptions and maturities of fixed maturity securities ............................. 6,583 6,795 11,203
Sales and redemptions of equity securities ........................................ 8,747 8,896 3,869
Purchases of loans and finance receivables ........................................ (179) (181) (490)
Collections of loans and finance receivables ...................................... 492 885 654
Acquisitions of businesses, net of cash acquired ................................... (4,902) (4,824) (6,431)
Purchases of property, plant and equipment ....................................... (16,082) (15,185) (11,087)
Other ..................................................................... 165 336 (1,210)
Net cash flows from investing activities .............................................. (26,668) (19,369) (27,535)
Cash flows from financing activities:
Proceeds from borrowings of insurance and other businesses ......................... 3,358 845 2,622
Proceeds from borrowings of railroad, utilities and energy businesses .................. 5,479 5,765 7,491
Proceeds from borrowings of finance businesses ................................... 1,045 1,148 3,462
Repayments of borrowings of insurance and other businesses ......................... (1,916) (1,289) (2,750)
Repayments of borrowings of railroad, utilities and energy businesses .................. (1,725) (1,862) (1,596)
Repayments of borrowings of finance businesses .................................. (1,827) (1,543) (3,927)
Changes in short term borrowings, net ........................................... (378) 932 (1,317)
Acquisitions of noncontrolling interests .......................................... (72) (1,287) (2,890)
Other ..................................................................... (161) 22 (134)
Net cash flows from financing activities .............................................. 3,803 2,731 961
Effects of foreign currency exchange rate changes ...................................... (165) (289) 64
Increase in cash and cash equivalents ................................................ 8,461 15,083 1,194
Cash and cash equivalents at beginning of year ........................................ 63,269 48,186 46,992
Cash and cash equivalents at end of year * .......................................... $71,730 $ 63,269 $ 48,186
* Cash and cash equivalents at end of year are comprised of the following:
Insurance and Other ......................................................... $ 61,181 $ 57,974 $ 42,433
Railroad, Utilities and Energy ................................................. 3,437 3,001 3,400
Finance and Financial Products ................................................ 7,112 2,294 2,353
$ 71,730 $ 63,269 $ 48,186
See accompanying Notes to Consolidated Financial Statements
40