Berkshire Hathaway 2015 Annual Report Download - page 21
Download and view the complete annual report
Please find page 21 of the 2015 Berkshire Hathaway annual report below. You can navigate through the pages in the report by either clicking on the pages listed below, or by using the keyword search tool below to find specific information within the annual report.-
 1
1 -
2
-
3
-
4
-
5
-
6
-
7
-
8
-
9
-
10
-
 11
11 -
 12
12 -
 13
13 -
 14
14 -
 15
15 -
 16
16 -
 17
17 -
 18
18 -
 19
19 -
 20
20 -
 21
21 -
 22
22 -
 23
23 -
 24
24 -
 25
25 -
 26
26 -
 27
27 -
 28
28 -
 29
29 -
 30
30 -
 31
31 -
32
-
33
-
34
-
35
-
36
-
37
-
38
-
39
-
40
-
41
-
42
-
43
-
44
-
45
-
46
-
47
-
48
-
49
-
50
-
51
-
52
-
53
-
54
-
55
-
56
-
57
-
58
-
59
-
60
-
61
-
62
-
63
-
64
-
65
-
66
-
67
-
68
-
69
-
70
-
71
-
72
-
73
-
74
-
75
-
76
-
77
-
78
-
79
-
80
-
81
-
82
-
83
-
84
-
85
-
86
-
87
-
88
-
89
-
90
-
91
-
92
-
93
-
94
-
95
-
96
-
97
-
98
-
99
-
100
-
101
-
102
-
103
-
104
-
105
-
106
-
107
-
108
-
109
-
110
-
111
-
112
-
113
-
114
-
115
-
116
-
117
-
118
-
119
-
120
-
121
-
122
-
123
-
124
 |
 |

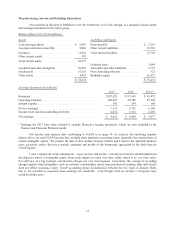
Normally, it is risky business to lend long at fixed rates and borrow short as we have been doing at
Clayton. Over the years, some important financial institutions have gone broke doing that. At Berkshire, however,
we possess a natural offset in that our businesses always maintain at least $20 billion in cash-equivalents that earn
short-term rates. More often, our short-term investments are in the $40 billion to $60 billion range. If we have, say,
$60 billion invested at
1
⁄
4
% or less, a sharp move to higher short-term rates would bring benefits to us far exceeding
the higher financing costs we would incur in funding Clayton’s $13 billion mortgage portfolio. In banking terms,
Berkshire is – and always will be – heavily asset-sensitive and will consequently benefit from rising interest rates.
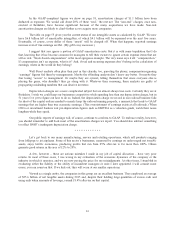
Let me talk about one subject of which I am particularly proud, that having to do with regulation. The
Great Recession caused mortgage originators, servicers and packagers to come under intense scrutiny and to be
assessed many billions of dollars in fines and penalties.
The scrutiny has certainly extended to Clayton, whose mortgage practices have been continuously
reviewed and examined in respect to such items as originations, servicing, collections, advertising, compliance, and
internal controls. At the federal level, we answer to the Federal Trade Commission, the Department of Housing and
Urban Development and the Consumer Financial Protection Bureau. Dozens of states regulate us as well. During the
past two years, indeed, various federal and state authorities (from 25 states) examined and reviewed Clayton and its
mortgages on 65 occasions. The result? Our total fines during this period were $38,200 and our refunds to customers
$704,678. Furthermore, though we had to foreclose on 2.64% of our manufactured-home mortgages last year,
95.4% of our borrowers were current on their payments at yearend, as they moved toward owning a debt-free home.
************
Marmon’s rail fleet expanded to 133,220 units by yearend, a number significantly increased by the
company’s purchase of 25,085 cars from General Electric on September 30. If our fleet was connected to form a
single train, the engine would be in Omaha and the caboose in Portland, Maine.
At yearend, 97% of our railcars were leased, with about 15-17% of the fleet coming up for renewal each
year. Though “tank cars” sound like vessels carrying crude oil, only about 7% of our fleet carries that product;
chemicals and refined petroleum products are the lead items we transport. When trains roll by, look for the UTLX or
Procor markings that identify our tank cars. When you spot the brand, puff out your chest; you own a portion of that
car.
Here’s the earnings recap for this sector:
2015 2014 2013
(in millions)
Berkadia (our 50% share) ............................. $ 74 $ 122 $ 80
Clayton ............................................ 706 558 416
CORT ............................................. 55 49 42
Marmon – Containers and Cranes ....................... 192 238 226
Marmon – Railcars ................................... 546 442 353
XTRA ............................................. 172 147 125
Net financial income* ................................ 341 283 322
$ 2,086 $ 1,839 $ 1,564
* Excludes capital gains or losses
19