Berkshire Hathaway 2015 Annual Report Download - page 81
Download and view the complete annual report
Please find page 81 of the 2015 Berkshire Hathaway annual report below. You can navigate through the pages in the report by either clicking on the pages listed below, or by using the keyword search tool below to find specific information within the annual report.-
 1
1 -
2
-
3
-
4
-
5
-
6
-
7
-
8
-
9
-
10
-
11
-
12
-
13
-
14
-
15
-
16
-
17
-
18
-
19
-
20
-
21
-
22
-
23
-
24
-
25
-
26
-
27
-
28
-
29
-
30
-
31
-
32
-
33
-
34
-
35
-
36
-
37
-
38
-
39
-
40
-
41
-
42
-
43
-
44
-
45
-
46
-
47
-
48
-
49
-
50
-
51
-
52
-
53
-
54
-
55
-
56
-
57
-
58
-
59
-
60
-
61
-
62
-
63
-
64
-
65
-
66
-
67
-
68
-
69
-
70
-
 71
71 -
 72
72 -
 73
73 -
 74
74 -
 75
75 -
 76
76 -
 77
77 -
 78
78 -
 79
79 -
 80
80 -
 81
81 -
 82
82 -
 83
83 -
 84
84 -
 85
85 -
 86
86 -
 87
87 -
 88
88 -
 89
89 -
 90
90 -
 91
91 -
92
-
93
-
94
-
95
-
96
-
97
-
98
-
99
-
100
-
101
-
102
-
103
-
104
-
105
-
106
-
107
-
108
-
109
-
110
-
111
-
112
-
113
-
114
-
115
-
116
-
117
-
118
-
119
-
120
-
121
-
122
-
123
-
124
 |
 |

Management’s Discussion and Analysis (Continued)
Insurance—Underwriting (Continued)
General Re (Continued)
Life/health
In 2015, life/health premiums written and earned were relatively unchanged from 2014. However, adjusting for changes in
foreign currency exchange rates, premiums earned in 2015 increased $266 million (8%) as compared to 2014. In 2015, life
business increased across a number of non-U.S. markets, particularly in Canada and Asia.
Our life/health business produced aggregate pre-tax underwriting losses in 2015 of $18 million compared to gains of $73
million in 2014. In 2015, our North American long-term care business generated increased underwriting losses of $77 million
compared to 2014 due primarily to increased reserves from estimated premium deficiencies. Also we experienced higher
frequency and severity of losses in North American individual life business, which were partially offset by increased
underwriting gains from international life business.
Premiums written and earned in 2014 increased $170 million (5.7%) and $184 million (6.2%), respectively, compared to
2013. Adjusting for changes in foreign currency exchange rates, premiums earned in 2014 increased 8% over 2013, which
primarily derived from life business across a number of non-U.S. markets.
Our life/health operations produced pre-tax underwriting gains of $73 million in 2014 compared to $112 million in 2013.
In 2014, we increased benefit liabilities by approximately $50 million as a result of reducing discount rates for certain European
long-term care and disability business. In 2014, we also experienced increased frequency and severity of claims in Australian
disability business.
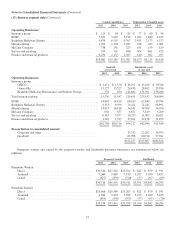
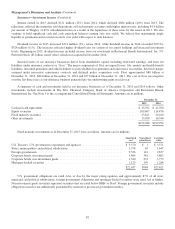
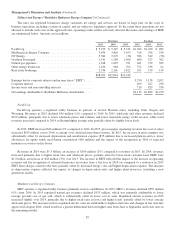
Berkshire Hathaway Reinsurance Group
BHRG underwrites excess-of-loss reinsurance and quota-share coverages on property and casualty risks for insurers and
reinsurers worldwide, including property catastrophe insurance and reinsurance. The timing and magnitude of catastrophe losses
can produce extraordinary volatility in the periodic underwriting results. Occasionally, BHRG also writes retroactive
reinsurance, which provides indemnification of losses and loss adjustment expenses with respect to past loss events arising
under property/casualty coverages. BHRG’s underwriting activities also include life reinsurance and periodic payment annuity
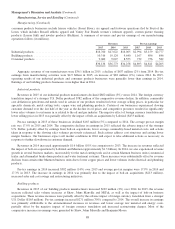
businesses. BHRG’s underwriting results are summarized in the table below. Amounts are in millions.
Premiums written Premiums earned Pre-tax underwriting gain (loss)
2015 2014 2013 2015 2014 2013 2015 2014 2013
Property/casualty ......................... $4,702 $ 4,097 $4,768 $4,416 $ 4,064 $5,149 $ 944 $1,411 $1,248
Retroactive reinsurance .................... 5 3,371 328 5 3,371 328 (469) (632) (333)
Life and annuity .......................... 2,786 2,681 3,309 2,786 2,681 3,309 (54) (173) 379
$7,493 $10,149 $8,405 $7,207 $10,116 $8,786 $ 421 $ 606 $1,294
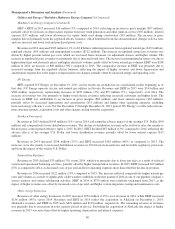
Property/casualty
Premiums written and earned in 2015 increased $605 million (15%) and $352 million (9%), respectively, compared to
2014. These increases were primarily attributable to a new 10-year, 20% quota-share contract with Insurance Australia Group
Ltd. (“IAG”), which became effective on July 1, 2015. Partially offsetting this increase were premium declines in property
catastrophe, property quota-share and London facilities business. Our premium volume is generally constrained for most
property/casualty coverages, and for property catastrophe coverages in particular as rates, in our view, are inadequate. However,
we have the capacity and desire to write substantially more business when appropriate pricing can be obtained.
The property/casualty business generated pre-tax underwriting gains in 2015 of $944 million compared to $1.4 billion in
2014. In 2015, we incurred losses of $86 million from an explosion in Tianjin, China. There were no significant catastrophe
losses in 2014. Underwriting results in 2015 included comparatively lower gains from property catastrophe reinsurance and the
run off of prior years’ business.
Premiums earned in 2014 were $4.1 billion, a decline of $1.1 billion (21%) compared to 2013. Premiums earned in 2014
with respect to a 20% quota-share contract with Swiss Reinsurance Company Ltd. (“Swiss Re”) declined $1.3 billion from
premiums earned in 2013. The Swiss Re contract expired at the end of 2012 and is in run-off. Property catastrophe premiums
earned in 2014 declined $113 million (14%) as compared to 2013. These declines were partially offset by increased premiums
earned from property quota-share contracts.
79