Berkshire Hathaway 2015 Annual Report Download - page 56
Download and view the complete annual report
Please find page 56 of the 2015 Berkshire Hathaway annual report below. You can navigate through the pages in the report by either clicking on the pages listed below, or by using the keyword search tool below to find specific information within the annual report.-
 1
1 -
2
-
3
-
4
-
5
-
6
-
7
-
8
-
9
-
10
-
11
-
12
-
13
-
14
-
15
-
16
-
17
-
18
-
19
-
20
-
21
-
22
-
23
-
24
-
25
-
26
-
27
-
28
-
29
-
30
-
31
-
32
-
33
-
34
-
35
-
36
-
37
-
38
-
39
-
40
-
41
-
42
-
43
-
44
-
45
-
 46
46 -
 47
47 -
 48
48 -
 49
49 -
 50
50 -
 51
51 -
 52
52 -
 53
53 -
 54
54 -
 55
55 -
 56
56 -
 57
57 -
 58
58 -
 59
59 -
 60
60 -
 61
61 -
 62
62 -
 63
63 -
 64
64 -
 65
65 -
 66
66 -
67
-
68
-
69
-
70
-
71
-
72
-
73
-
74
-
75
-
76
-
77
-
78
-
79
-
80
-
81
-
82
-
83
-
84
-
85
-
86
-
87
-
88
-
89
-
90
-
91
-
92
-
93
-
94
-
95
-
96
-
97
-
98
-
99
-
100
-
101
-
102
-
103
-
104
-
105
-
106
-
107
-
108
-
109
-
110
-
111
-
112
-
113
-
114
-
115
-
116
-
117
-
118
-
119
-
120
-
121
-
122
-
123
-
124
 |
 |

Notes to Consolidated Financial Statements (Continued)
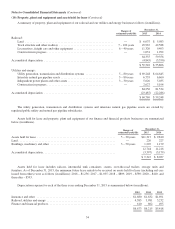
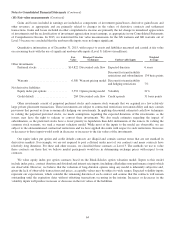
(10) Property, plant and equipment and assets held for lease (Continued)
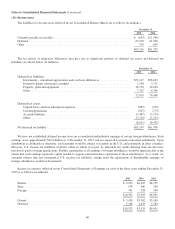
A summary of property, plant and equipment of our railroad and our utilities and energy businesses follows (in millions).
Ranges of
estimated useful life
December 31,
2015 2014
Railroad:
Land ............................................................ — $ 6,037 $ 5,983
Track structure and other roadway ..................................... 7–100years 45,967 42,588
Locomotives, freight cars and other equipment ........................... 6–40years 11,320 9,493
Construction in progress ............................................. — 1,031 1,292
64,355 59,356
Accumulated depreciation ............................................... (4,845) (3,550)
$ 59,510 $ 55,806
Utilities and energy:
Utility generation, transmission and distribution systems ................... 5–80years $ 69,248 $ 64,645
Interstate natural gas pipeline assets .................................... 3–80years 6,755 6,660
Independent power plants and other assets ............................... 3–30years 5,626 5,035
Construction in progress ............................................. — 2,627 5,194
84,256 81,534
Accumulated depreciation ............................................... (23,487) (22,286)
$ 60,769 $ 59,248
The utility generation, transmission and distribution systems and interstate natural gas pipeline assets are owned by
regulated public utility and natural gas pipeline subsidiaries.
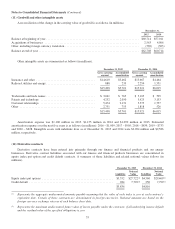
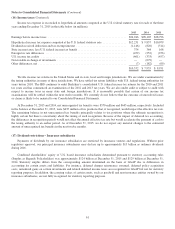
Assets held for lease and property, plant and equipment of our finance and financial products businesses are summarized
below (in millions).
Ranges of
estimated useful life
December 31,
2015 2014
Assets held for lease ..................................................... 5–30years $11,317 $ 9,810
Land .................................................................. — 220 227
Buildings, machinery and other ............................................ 3–50years 1,207 1,179
12,744 11,216
Accumulated depreciation ................................................. (3,397) (3,179)
$ 9,347 $ 8,037
Assets held for lease includes railcars, intermodal tank containers, cranes, over-the-road trailers, storage units and
furniture. As of December 31, 2015, the minimum future lease rentals to be received on assets held for lease (including rail cars
leased from others) were as follows (in millions): 2016 – $1,256; 2017 – $1,035; 2018 – $809; 2019 – $589; 2020 – $410; and
thereafter – $593.
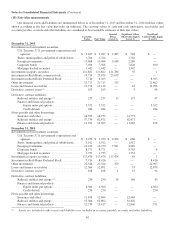
Depreciation expense for each of the three years ending December 31, 2015 is summarized below (in millions).
2015 2014 2013
Insurance and other ................................................................ $1,680 $1,632 $1,691
Railroad, utilities and energy ......................................................... 4,383 3,981 3,232
Finance and financial products ........................................................ 610 602 495
$6,673 $6,215 $5,418
54