Berkshire Hathaway 2015 Annual Report Download - page 89
Download and view the complete annual report
Please find page 89 of the 2015 Berkshire Hathaway annual report below. You can navigate through the pages in the report by either clicking on the pages listed below, or by using the keyword search tool below to find specific information within the annual report.-
 1
1 -
2
-
3
-
4
-
5
-
6
-
7
-
8
-
9
-
10
-
11
-
12
-
13
-
14
-
15
-
16
-
17
-
18
-
19
-
20
-
21
-
22
-
23
-
24
-
25
-
26
-
27
-
28
-
29
-
30
-
31
-
32
-
33
-
34
-
35
-
36
-
37
-
38
-
39
-
40
-
41
-
42
-
43
-
44
-
45
-
46
-
47
-
48
-
49
-
50
-
51
-
52
-
53
-
54
-
55
-
56
-
57
-
58
-
59
-
60
-
61
-
62
-
63
-
64
-
65
-
66
-
67
-
68
-
69
-
70
-
71
-
72
-
73
-
74
-
75
-
76
-
77
-
78
-
 79
79 -
 80
80 -
 81
81 -
 82
82 -
 83
83 -
 84
84 -
 85
85 -
 86
86 -
 87
87 -
 88
88 -
 89
89 -
 90
90 -
 91
91 -
 92
92 -
 93
93 -
 94
94 -
 95
95 -
 96
96 -
 97
97 -
 98
98 -
 99
99 -
100
-
101
-
102
-
103
-
104
-
105
-
106
-
107
-
108
-
109
-
110
-
111
-
112
-
113
-
114
-
115
-
116
-
117
-
118
-
119
-
120
-
121
-
122
-
123
-
124
 |
 |

Management’s Discussion and Analysis (Continued)
Utilities and Energy (“Berkshire Hathaway Energy Company”) (Continued)
Other energy businesses (Continued)
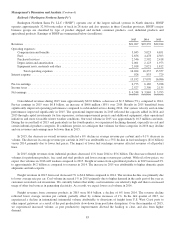
Revenues and EBIT in 2014 from other energy businesses increased $372 million and $174 million, respectively, over
revenues and EBIT in 2013. The increases were primarily attributable to increased revenues from new solar facilities as
additional assets were placed in service and the acquisition of AltaLink on December 1, 2014.
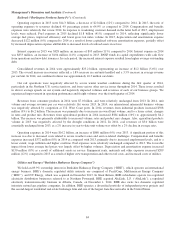
Real estate brokerage
Real estate brokerage revenues and EBIT in 2015 increased 17% and 37%, respectively, compared to 2014. The revenue
increase reflected comparative increases in closed transactions and average home prices and the impact of business acquisitions.
The increase in EBIT in 2015 was primarily due to the increased revenues, net of commission expense, as well as a lower
operating expense to revenue ratio as compared to 2014.
Revenues of the real estate brokerage businesses increased $339 million (19%) in 2014 as compared to 2013. The increase
reflected the impact of revenues from acquired businesses, partially offset by lower revenues from existing operations, due to a
6% decline in closed units and lower franchise revenues. EBIT of $139 million in 2014 were unchanged from 2013 as the
increase in EBIT from acquired businesses was offset by lower EBIT from existing businesses and higher operating expenses.
Corporate interest and income taxes
Corporate interest includes interest on unsecured debt issued by BHE. In 2015 and 2014, corporate interest expense
increased over the corresponding prior year due to new borrowings in connection with the NV Energy and AltaLink
acquisitions.
BHE’s consolidated effective income tax rates were approximately 16% in 2015, 23% in 2014 and 7% in 2013. In each
year, BHE’s income tax rates reflect significant production tax credits from wind-powered electricity generation in the United
States. BHE’s effective rates in 2015 and 2013 included the impact of reductions in deferred income tax liabilities as a result of
enacted statutory income tax rate decreases in the United Kingdom and increased deferred state income tax benefits.
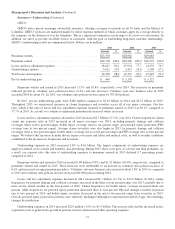
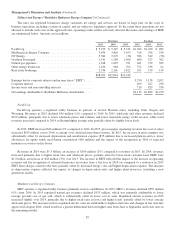
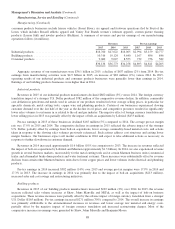
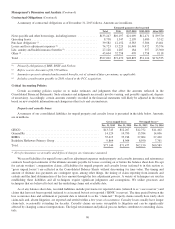
Manufacturing, Service and Retailing
A summary of revenues and earnings of our manufacturing, retailing and service businesses follows. Amounts are
in millions.
Revenues Earnings
2015 2014 2013 2015 2014 2013
Manufacturing .......................................... $ 36,136 $36,773 $34,258 $4,893 $4,811 $4,205
Service and retailing ..................................... 71,689 60,916 59,214 2,222 1,981 1,955
$107,825 $97,689 $93,472
Pre-tax earnings ......................................... 7,115 6,792 6,160
Income taxes and noncontrolling interests .................... 2,432 2,324 2,283
$4,683 $4,468 $3,877
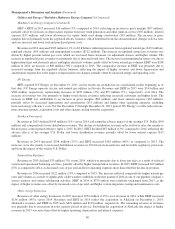
Manufacturing
Our manufacturing group includes a variety of businesses that produce industrial, building and consumer products. Our industrial
products businesses include specialty chemicals (The Lubrizol Corporation), metal cutting tools/systems (IMC International
Metalworking Companies), equipment and systems for the livestock and agricultural industries (CTB International), and a variety of
industrial products for diverse markets (Marmon and Scott Fetzer). Our building products businesses include flooring (Shaw),
insulation, roofing and engineered products (Johns Manville), bricks and masonry products (Acme Building Brands), paint and
coatings (Benjamin Moore), and residential and commercial construction and engineering products and systems (MiTek). Our
87