Berkshire Hathaway 2015 Annual Report Download - page 54
Download and view the complete annual report
Please find page 54 of the 2015 Berkshire Hathaway annual report below. You can navigate through the pages in the report by either clicking on the pages listed below, or by using the keyword search tool below to find specific information within the annual report.-
 1
1 -
2
-
3
-
4
-
5
-
6
-
7
-
8
-
9
-
10
-
11
-
12
-
13
-
14
-
15
-
16
-
17
-
18
-
19
-
20
-
21
-
22
-
23
-
24
-
25
-
26
-
27
-
28
-
29
-
30
-
31
-
32
-
33
-
34
-
35
-
36
-
37
-
38
-
39
-
40
-
41
-
42
-
43
-
 44
44 -
 45
45 -
 46
46 -
 47
47 -
 48
48 -
 49
49 -
 50
50 -
 51
51 -
 52
52 -
 53
53 -
 54
54 -
 55
55 -
 56
56 -
 57
57 -
 58
58 -
 59
59 -
 60
60 -
 61
61 -
 62
62 -
 63
63 -
 64
64 -
65
-
66
-
67
-
68
-
69
-
70
-
71
-
72
-
73
-
74
-
75
-
76
-
77
-
78
-
79
-
80
-
81
-
82
-
83
-
84
-
85
-
86
-
87
-
88
-
89
-
90
-
91
-
92
-
93
-
94
-
95
-
96
-
97
-
98
-
99
-
100
-
101
-
102
-
103
-
104
-
105
-
106
-
107
-
108
-
109
-
110
-
111
-
112
-
113
-
114
-
115
-
116
-
117
-
118
-
119
-
120
-
121
-
122
-
123
-
124
 |
 |

Notes to Consolidated Financial Statements (Continued)
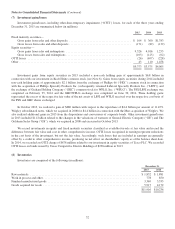
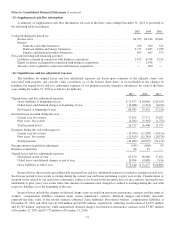
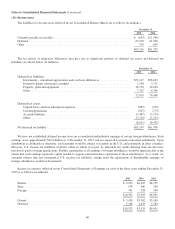
(7) Investment gains/losses
Investment gains/losses, including other-than-temporary impairment (“OTTI”) losses, for each of the three years ending
December 31, 2015 are summarized below (in millions).
2015 2014 2013
Fixed maturity securities—
Gross gains from sales and other disposals .......................................... $ 104 $ 360 $1,783
Gross losses from sales and other disposals .......................................... (171) (89) (139)
Equity securities—
Gross gains from sales and redemptions ............................................ 9,526 4,016 1,253
Gross losses from sales and redemptions ............................................ (103) (125) (62)
OTTI losses ...................................................................... (26) (697) (228)
Other ............................................................................ 43 110 1,458
$9,373 $3,575 $4,065
Investment gains from equity securities in 2015 included a non-cash holding gain of approximately $6.8 billion in
connection with our investment in Kraft Heinz common stock (see Note 6). Gains from equity securities during 2014 included
non-cash holding gains of approximately $2.1 billion from the exchange of Phillips 66 (“PSX”) common stock in connection
with the acquisition of Phillips Specialty Products Inc. (subsequently renamed Lubrizol Specialty Products Inc. (“LSPI”)) and
the exchange of Graham Holding Company (“GHC”) common stock for WPLG, Inc. (“WPLG”). The PSX/LSPI exchange was
completed on February 25, 2014 and the GHC/WPLG exchange was completed on June 30, 2014. These holding gains
represented the excess of the respective fair value of the net assets of LSPI and WPLG received over the respective cost basis of
the PSX and GHC shares exchanged.
In October 2013, we realized a gain of $680 million with respect to the repurchase of $4.4 billion par amount of 11.45%
Wrigley subordinated notes, which we acquired in 2008 for $4.4 billion in connection with the Mars acquisition of Wrigley. We
also realized additional gains in 2013 from the dispositions and conversions of corporate bonds. Other investment gains/losses
in 2013 included $1.4 billion related to the changes in the valuations of warrants of General Electric Company (“GE”) and The
Goldman Sachs Group (“GS”), which we acquired in 2008 and exercised in October 2013.
We record investments in equity and fixed maturity securities classified as available-for-sale at fair value and record the
difference between fair value and cost in other comprehensive income. OTTI losses recognized in earnings represent reductions
in the cost basis of the investment, but not the fair value. Accordingly, such losses that are included in earnings are generally
offset by a credit to other comprehensive income, producing no net effect on shareholders’ equity as of the balance sheet date.
In 2014, we recorded an OTTI charge of $678 million related to our investment in equity securities of Tesco PLC. We recorded
OTTI losses on bonds issued by Texas Competitive Electric Holdings of $228 million in 2013.
(8) Inventories
Inventories are comprised of the following (in millions).
December 31,
2015 2014
Raw materials .......................................................................... $ 1,852 $ 1,881
Work in process and other ................................................................. 778 850
Finished manufactured goods .............................................................. 3,369 3,333
Goods acquired for resale ................................................................. 5,917 4,172
$11,916 $10,236
52