Berkshire Hathaway 2015 Annual Report Download - page 85
Download and view the complete annual report
Please find page 85 of the 2015 Berkshire Hathaway annual report below. You can navigate through the pages in the report by either clicking on the pages listed below, or by using the keyword search tool below to find specific information within the annual report.-
 1
1 -
2
-
3
-
4
-
5
-
6
-
7
-
8
-
9
-
10
-
11
-
12
-
13
-
14
-
15
-
16
-
17
-
18
-
19
-
20
-
21
-
22
-
23
-
24
-
25
-
26
-
27
-
28
-
29
-
30
-
31
-
32
-
33
-
34
-
35
-
36
-
37
-
38
-
39
-
40
-
41
-
42
-
43
-
44
-
45
-
46
-
47
-
48
-
49
-
50
-
51
-
52
-
53
-
54
-
55
-
56
-
57
-
58
-
59
-
60
-
61
-
62
-
63
-
64
-
65
-
66
-
67
-
68
-
69
-
70
-
71
-
72
-
73
-
74
-
 75
75 -
 76
76 -
 77
77 -
 78
78 -
 79
79 -
 80
80 -
 81
81 -
 82
82 -
 83
83 -
 84
84 -
 85
85 -
 86
86 -
 87
87 -
 88
88 -
 89
89 -
 90
90 -
 91
91 -
 92
92 -
 93
93 -
 94
94 -
 95
95 -
96
-
97
-
98
-
99
-
100
-
101
-
102
-
103
-
104
-
105
-
106
-
107
-
108
-
109
-
110
-
111
-
112
-
113
-
114
-
115
-
116
-
117
-
118
-
119
-
120
-
121
-
122
-
123
-
124
 |
 |

Management’s Discussion and Analysis (Continued)
Railroad (“Burlington Northern Santa Fe”)
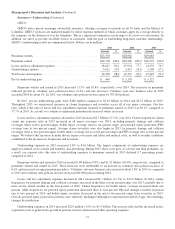
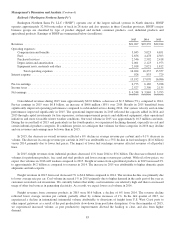
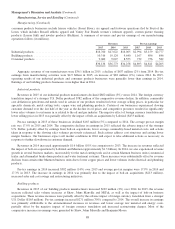
Burlington Northern Santa Fe, LLC (“BNSF”) operates one of the largest railroad systems in North America. BNSF
operates approximately 32,500 route miles of track in 28 states and also operates in three Canadian provinces. BNSF’s major
business groups are classified by type of product shipped and include consumer products, coal, industrial products and
agricultural products. Earnings of BNSF are summarized below (in millions).
2015 2014 2013
Revenues ..................................................................... $21,967 $23,239 $22,014
Operating expenses:
Compensation and benefits ................................................... 5,043 5,023 4,651
Fuel ...................................................................... 2,656 4,478 4,503
Purchased services .......................................................... 2,546 2,592 2,418
Depreciation and amortization ................................................. 2,001 2,123 1,973
Equipment rents, materials and other ............................................ 2,018 2,021 1,812
Total operating expenses ................................................. 14,264 16,237 15,357
Interest expense ................................................................ 928 833 729
15,192 17,070 16,086
Pre-tax earnings ................................................................ 6,775 6,169 5,928
Income taxes ................................................................... 2,527 2,300 2,135
Net earnings ................................................................... $ 4,248 $ 3,869 $ 3,793
Consolidated revenues during 2015 were approximately $22.0 billion, a decrease of $1.3 billion (5%), compared to 2014.
Pre-tax earnings in 2015 were $6.8 billion, an increase of $606 million (10%) over 2014. Results in 2015 benefitted from
significantly improved operating performance compared to substandard service during 2014. Our system velocity and on-time
performance improved significantly in 2015. The operational improvements in 2015 reflected the capacity added in 2014 and
2015 through capital investments for line expansion, system improvement projects and additional equipment, other operational
initiatives and more favorable winter weather conditions. Our total volume in 2015 was approximately 10.3 million cars/units.
During the second half of 2015 and particularly in the fourth quarter, we experienced declining demand, especially in coal and
certain industrial products categories. If conditions persist, we anticipate that volumes for these categories in 2016 may decline
and our revenues and earnings may be lower than in 2015.
In 2015, the decrease in overall revenues reflected a 6% decline in average revenue per car/unit and a 0.1% decrease in
volume. The decrease in average revenue per car/unit in 2015 was attributable to a 55% decline in fuel surcharges ($1.6 billion)
versus 2014, primarily due to lower fuel prices. The impact of lower fuel surcharge revenues affected revenues of all product
lines.
In 2015, freight revenues from industrial products decreased 11% from 2014 to $5.6 billion. The decrease reflected lower
volumes for petroleum products, frac sand and steel products and lower average revenue per car/unit. With oil at low prices, we
expect that volumes in 2016 will weaken compared to 2015. Freight revenues from agricultural products in 2015 increased 2%
to approximately $4.2 billion as compared to revenues in 2014. The increase in 2015 was attributable to higher domestic grain
shipments and milo exports.
Freight revenues in 2015 from coal decreased 7% to $4.6 billion compared to 2014. The revenue decline was primarily due
to lower average rate per car. Coal volume increased 1% in 2015 primarily due to higher demand in the early part of the year as
customers restocked coal inventories. We currently believe that utility coal inventories are relatively high and there is increased
usage of other fuel sources in generating electricity. As a result, we expect lower coal volume in 2016.
Freight revenues from consumer products in 2015 were $6.6 billion, a decline of 6% from 2014. The revenue decline
reflected lower average revenue per car/unit, partially offset by volume increases of 1%. In the first quarter of 2015, we
experienced a decline in international intermodal volume attributable to diversions of freight from U.S. West Coast ports to
other import gateways as a result of the port productivity slow-down from port labor disruptions. Over the remainder of 2015,
we experienced increased volume, as port productivity improvements allowed the backlog to clear, and also from higher
demand.
83