Berkshire Hathaway 2015 Annual Report Download - page 59
Download and view the complete annual report
Please find page 59 of the 2015 Berkshire Hathaway annual report below. You can navigate through the pages in the report by either clicking on the pages listed below, or by using the keyword search tool below to find specific information within the annual report.-
 1
1 -
2
-
3
-
4
-
5
-
6
-
7
-
8
-
9
-
10
-
11
-
12
-
13
-
14
-
15
-
16
-
17
-
18
-
19
-
20
-
21
-
22
-
23
-
24
-
25
-
26
-
27
-
28
-
29
-
30
-
31
-
32
-
33
-
34
-
35
-
36
-
37
-
38
-
39
-
40
-
41
-
42
-
43
-
44
-
45
-
46
-
47
-
48
-
 49
49 -
 50
50 -
 51
51 -
 52
52 -
 53
53 -
 54
54 -
 55
55 -
 56
56 -
 57
57 -
 58
58 -
 59
59 -
 60
60 -
 61
61 -
 62
62 -
 63
63 -
 64
64 -
 65
65 -
 66
66 -
 67
67 -
 68
68 -
 69
69 -
70
-
71
-
72
-
73
-
74
-
75
-
76
-
77
-
78
-
79
-
80
-
81
-
82
-
83
-
84
-
85
-
86
-
87
-
88
-
89
-
90
-
91
-
92
-
93
-
94
-
95
-
96
-
97
-
98
-
99
-
100
-
101
-
102
-
103
-
104
-
105
-
106
-
107
-
108
-
109
-
110
-
111
-
112
-
113
-
114
-
115
-
116
-
117
-
118
-
119
-
120
-
121
-
122
-
123
-
124
 |
 |

Notes to Consolidated Financial Statements (Continued)
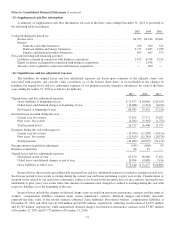
(13) Supplemental cash flow information
A summary of supplemental cash flow information for each of the three years ending December 31, 2015 is presented in
the following table (in millions).
2015 2014 2013
Cash paid during the period for:
Income taxes .................................................................. $4,535 $4,014 $5,401
Interest:
Insurance and other businesses ............................................... 346 360 343
Railroad, utilities and energy businesses ........................................ 2,717 2,487 1,958
Finance and financial products businesses ....................................... 403 465 573
Non-cash investing and financing activities:
Liabilities assumed in connection with business acquisitions ............................ 2,812 6,334 9,224
Equity securities exchanged in connection with business acquisitions ..................... — 2,478 —
Treasury stock acquired in connection with business acquisition ......................... — 400 —
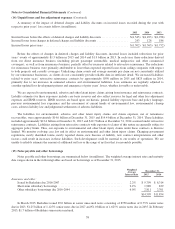
(14) Unpaid losses and loss adjustment expenses
The liabilities for unpaid losses and loss adjustment expenses are based upon estimates of the ultimate claim costs
associated with property and casualty claim occurrences as of the balance sheet dates. A reconciliation of the changes in
liabilities for unpaid losses and loss adjustment expenses of our property/casualty insurance subsidiaries for each of the three
years ending December 31, 2015 is as follows (in millions).
2015 2014 2013
Unpaid losses and loss adjustment expenses:
Gross liabilities at beginning of year .......................................... $71,477 $ 64,866 $ 64,160
Ceded losses and deferred charges at beginning of year ........................... (10,888) (7,414) (6,944)
Net balance at beginning of year ............................................. 60,589 57,452 57,216
Incurred losses recorded during the year:
Current year loss events .................................................... 27,829 27,771 23,027
Prior years’ loss events ..................................................... (1,302) (1,365) (1,752)
Total incurred losses ...................................................... 26,527 26,406 21,275
Payments during the year with respect to:
Current year loss events .................................................... (13,070) (11,289) (10,154)
Prior years’ loss events ..................................................... (11,419) (11,381) (10,978)
Total payments ........................................................... (24,489) (22,670) (21,132)
Foreign currency translation adjustment ........................................... (545) (666) 93
Business acquisitions .......................................................... 68 67 —
Unpaid losses and loss adjustment expenses:
Net balance at end of year .................................................. 62,150 60,589 57,452
Ceded losses and deferred charges at end of year ................................ 10,994 10,888 7,414
Gross liabilities at end of year ............................................... $73,144 $ 71,477 $ 64,866
Incurred losses shown in the preceding table represent loss and loss adjustment expenses recorded in earnings in each year.
Such losses pertain to loss events occurring during the current year and losses pertaining to prior year events. Classifications of
incurred losses related to our retroactive reinsurance contracts are based on the inception dates of the contracts. Incurred losses
attributable to prior years’ loss events reflect the amount of estimation error charged or credited to earnings during the year with
respect to liabilities as of the beginning of the year.
Incurred losses include the changes in deferred charge assets recorded on retroactive reinsurance contracts and discounts of
workers’ compensation liabilities assumed under certain reinsurance contracts. Deferred charges and liability discounts
represent the time value of the related ultimate estimated claim liabilities. Discounted workers’ compensation liabilities at
December 31, 2015 and 2014 were $1,964 million and $2,035 million, respectively, reflecting net discounts of $1,579 million
and $1,745 million, respectively, while unamortized deferred charges on retroactive reinsurance contracts were $7,687 million
at December 31, 2015 and $7,772 million at December 31, 2014.
57