Berkshire Hathaway 2015 Annual Report Download - page 75
Download and view the complete annual report
Please find page 75 of the 2015 Berkshire Hathaway annual report below. You can navigate through the pages in the report by either clicking on the pages listed below, or by using the keyword search tool below to find specific information within the annual report.-
 1
1 -
2
-
3
-
4
-
5
-
6
-
7
-
8
-
9
-
10
-
11
-
12
-
13
-
14
-
15
-
16
-
17
-
18
-
19
-
20
-
21
-
22
-
23
-
24
-
25
-
26
-
27
-
28
-
29
-
30
-
31
-
32
-
33
-
34
-
35
-
36
-
37
-
38
-
39
-
40
-
41
-
42
-
43
-
44
-
45
-
46
-
47
-
48
-
49
-
50
-
51
-
52
-
53
-
54
-
55
-
56
-
57
-
58
-
59
-
60
-
61
-
62
-
63
-
64
-
 65
65 -
 66
66 -
 67
67 -
 68
68 -
 69
69 -
 70
70 -
 71
71 -
 72
72 -
 73
73 -
 74
74 -
 75
75 -
 76
76 -
 77
77 -
 78
78 -
 79
79 -
 80
80 -
 81
81 -
 82
82 -
 83
83 -
 84
84 -
 85
85 -
86
-
87
-
88
-
89
-
90
-
91
-
92
-
93
-
94
-
95
-
96
-
97
-
98
-
99
-
100
-
101
-
102
-
103
-
104
-
105
-
106
-
107
-
108
-
109
-
110
-
111
-
112
-
113
-
114
-
115
-
116
-
117
-
118
-
119
-
120
-
121
-
122
-
123
-
124
 |
 |

Notes to Consolidated Financial Statements (Continued)
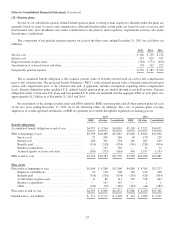
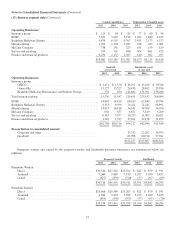
(23) Business segment data (Continued)
Capital expenditures Depreciation of tangible assets
2015 2014 2013 2015 2014 2013
Operating Businesses:
Insurance group .......................................... $ 115 $ 94 $ 89 $ 77 $ 69 $ 58
BNSF .................................................. 5,651 5,243 3,918 1,932 1,804 1,655
Berkshire Hathaway Energy ................................ 5,876 6,555 4,307 2,451 2,177 1,577
Manufacturing ........................................... 1,292 1,324 1,037 938 943 1,061
McLane Company ........................................ 338 241 225 161 159 159
Service and retailing ...................................... 574 591 488 504 461 413
Finance and financial products .............................. 2,236 1,137 1,023 610 602 495
$16,082 $15,185 $11,087 $6,673 $6,215 $5,418
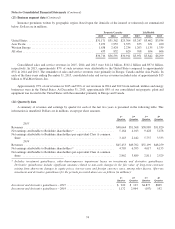
Goodwill
at year-end
Identifiable assets
at year-end
2015 2014 2015 2014 2013
Operating Businesses:
Insurance group:
GEICO ............................................... $ 1,471 $ 1,370 $ 48,291 $ 45,439 $ 39,568
General Re ............................................ 13,527 13,527 26,478 28,692 29,956
Berkshire Hathaway Reinsurance and Primary Groups .......... 538 650 144,682 151,301 138,480
Total insurance group ........................................ 15,536 15,547 219,451 225,432 208,004
BNSF .................................................... 14,845 14,819 66,613 62,840 59,784
Berkshire Hathaway Energy ................................... 9,333 9,599 74,221 71,285 61,991
Manufacturing ............................................. 14,833 14,818 34,141 34,509 34,100
McLane Company .......................................... 656 657 5,871 5,419 5,209
Service and retailing ......................................... 6,163 3,937 16,299 11,303 10,051
Finance and financial products ................................. 1,342 1,337 37,621 32,158 31,879
$62,708 $60,714 454,217 442,946 411,018
Reconciliation to consolidated amount:
Corporate and other ..................................... 35,332 22,207 16,595
Goodwill .............................................. 62,708 60,714 57,011
$552,257 $525,867 $484,624
Premiums written and earned by the property/casualty and life/health insurance businesses are summarized below (in
millions).
Property/Casualty Life/Health
2015 2014 2013 2015 2014 2013
Premiums Written:
Direct .............................................. $30,544 $27,541 $24,292 $ 821 $ 879 $ 931
Assumed ........................................... 7,049 9,889 7,339 5,187 5,030 5,437
Ceded .............................................. (877) (839) (720) (57) (67) (69)
$36,716 $36,591 $30,911 $5,951 $5,842 $6,299
Premiums Earned:
Direct .............................................. $29,608 $26,389 $23,267 $ 821 $ 879 $ 931
Assumed ........................................... 6,584 9,872 7,928 5,192 5,030 5,425
Ceded .............................................. (854) (850) (797) (57) (67) (70)
$35,338 $35,411 $30,398 $5,956 $5,842 $6,286
73