Berkshire Hathaway 2015 Annual Report Download - page 77
Download and view the complete annual report
Please find page 77 of the 2015 Berkshire Hathaway annual report below. You can navigate through the pages in the report by either clicking on the pages listed below, or by using the keyword search tool below to find specific information within the annual report.-
 1
1 -
2
-
3
-
4
-
5
-
6
-
7
-
8
-
9
-
10
-
11
-
12
-
13
-
14
-
15
-
16
-
17
-
18
-
19
-
20
-
21
-
22
-
23
-
24
-
25
-
26
-
27
-
28
-
29
-
30
-
31
-
32
-
33
-
34
-
35
-
36
-
37
-
38
-
39
-
40
-
41
-
42
-
43
-
44
-
45
-
46
-
47
-
48
-
49
-
50
-
51
-
52
-
53
-
54
-
55
-
56
-
57
-
58
-
59
-
60
-
61
-
62
-
63
-
64
-
65
-
66
-
 67
67 -
 68
68 -
 69
69 -
 70
70 -
 71
71 -
 72
72 -
 73
73 -
 74
74 -
 75
75 -
 76
76 -
 77
77 -
 78
78 -
 79
79 -
 80
80 -
 81
81 -
 82
82 -
 83
83 -
 84
84 -
 85
85 -
 86
86 -
 87
87 -
88
-
89
-
90
-
91
-
92
-
93
-
94
-
95
-
96
-
97
-
98
-
99
-
100
-
101
-
102
-
103
-
104
-
105
-
106
-
107
-
108
-
109
-
110
-
111
-
112
-
113
-
114
-
115
-
116
-
117
-
118
-
119
-
120
-
121
-
122
-
123
-
124
 |
 |

BERKSHIRE HATHAWAY INC.
and Subsidiaries
Management’s Discussion and Analysis of
Financial Condition and Results of Operations
Results of Operations
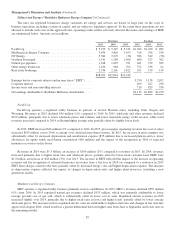
Net earnings attributable to Berkshire Hathaway shareholders for each of the past three years are disaggregated in the table
that follows. Amounts are after deducting income taxes and exclude earnings attributable to noncontrolling interests. Amounts
are in millions.
2015 2014 2013
Insurance – underwriting ......................................................... $ 1,162 $ 1,692 $ 1,995
Insurance – investment income .................................................... 3,725 3,542 3,708
Railroad ...................................................................... 4,248 3,869 3,793
Utilities and energy ............................................................. 2,132 1,882 1,470
Manufacturing, service and retailing ................................................ 4,683 4,468 3,877
Finance and financial products ..................................................... 1,378 1,243 1,008
Investment and derivative gains/losses .............................................. 6,725 3,321 4,337
Other ......................................................................... 30 (145) (712)
Net earnings attributable to Berkshire Hathaway shareholders ........................ $24,083 $19,872 $19,476
Through our subsidiaries, we engage in a number of diverse business activities. Our operating businesses are managed on
an unusually decentralized basis. There are essentially no centralized or integrated business functions (such as sales, marketing,
purchasing, legal or human resources) and there is minimal involvement by our corporate headquarters in the day-to-day
business activities of the operating businesses. Our senior corporate management team participates in and is ultimately
responsible for significant capital allocation decisions, investment activities and the selection of the Chief Executive to head
each of the operating businesses. It also is responsible for establishing and monitoring Berkshire’s corporate governance
practices, including, but not limited to, communicating the appropriate “tone at the top” messages to its employees and
associates, monitoring governance efforts, including those at the operating businesses, and participating in the resolution of
governance-related issues as needed. The business segment data (Note 23 to the accompanying Consolidated Financial
Statements) should be read in conjunction with this discussion.
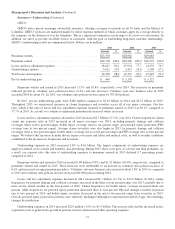
Our insurance businesses generated after-tax earnings from underwriting of $1.2 billion in 2015, a decline of $530 million
from 2014, which reflected rising claim costs at GEICO and lower earnings from our reinsurers, partially offset by increased
earnings from our other primary insurance operations. In 2014, earnings from underwriting declined $303 million compared to
2013, which was primarily due to lower earnings from reinsurance.
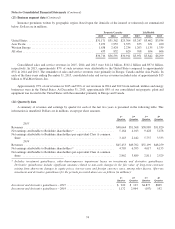
Our railroad business generated a 9.8% increase in after-tax earnings in 2015 compared to 2014. Results in 2015 were
positively impacted by improved service levels and lower fuel costs. Railroad earnings increased 2.0% in 2014 compared to
2013, although earnings were negatively impacted by various service-related challenges during the year.
After-tax earnings of our utilities and energy businesses in 2015 increased 13.3% over 2014, which increased 28.0% over
2013. Earnings in 2015 and 2014 benefitted from the inclusion of newly-acquired businesses (AltaLink beginning in December
2014 and NV Energy beginning in December 2013) and higher earnings from several of our other energy businesses.
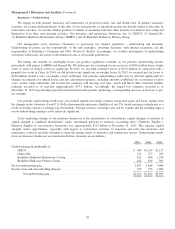
After-tax earnings of our manufacturing, service and retailing businesses in 2015 increased 4.8% in the aggregate over
2014. In 2015, the positive impacts of business acquisitions and higher earnings from our building products businesses were
partly offset by lower earnings from certain of our industrial products and service businesses. Earnings of our manufacturing,
service and retailing businesses in 2014 increased 15.2% over 2013, reflecting the impact of bolt-on business acquisitions,
earnings growth in certain operations and reductions in earnings attributable to noncontrolling interests.
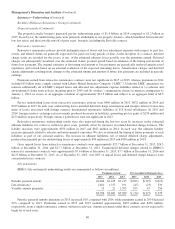
After-tax investment and derivative gains/losses were approximately $6.7 billion in 2015, $3.3 billion in 2014 and $4.3
billion in 2013. In 2015, after-tax gains included a non-cash holding gain of approximately $4.4 billion that was realized in
connection with our investment in Kraft Heinz common stock. In 2014, after-tax gains included approximately $2.0 billion
related to the exchanges of Phillips 66 common stock and Graham Holdings Company common stock for a specified subsidiary
of each of those companies. After-tax investment gains in 2013 included gains associated with the fair value increases of certain
investment securities where unrealized gains or losses were reflected in periodic earnings. Derivative contracts contributed
after-tax gains of $633 million in 2015, $329 million in 2014 and $1.7 billion in 2013. We believe that investment and
derivative gains/losses are often meaningless in terms of understanding our reported results or evaluating our economic
performance. These gains and losses have caused and will likely continue to cause significant volatility in our periodic earnings.
75