Berkshire Hathaway 2014 Annual Report Download - page 99
Download and view the complete annual report
Please find page 99 of the 2014 Berkshire Hathaway annual report below. You can navigate through the pages in the report by either clicking on the pages listed below, or by using the keyword search tool below to find specific information within the annual report.-
 1
1 -
2
-
3
-
4
-
5
-
6
-
7
-
8
-
9
-
10
-
11
-
12
-
13
-
14
-
15
-
16
-
17
-
18
-
19
-
20
-
21
-
22
-
23
-
24
-
25
-
26
-
27
-
28
-
29
-
30
-
31
-
32
-
33
-
34
-
35
-
36
-
37
-
38
-
39
-
40
-
41
-
42
-
43
-
44
-
45
-
46
-
47
-
48
-
49
-
50
-
51
-
52
-
53
-
54
-
55
-
56
-
57
-
58
-
59
-
60
-
61
-
62
-
63
-
64
-
65
-
66
-
67
-
68
-
69
-
70
-
71
-
72
-
73
-
74
-
75
-
76
-
77
-
78
-
79
-
80
-
81
-
82
-
83
-
84
-
85
-
86
-
87
-
88
-
 89
89 -
 90
90 -
 91
91 -
 92
92 -
 93
93 -
 94
94 -
 95
95 -
 96
96 -
 97
97 -
 98
98 -
 99
99 -
 100
100 -
 101
101 -
 102
102 -
 103
103 -
 104
104 -
 105
105 -
 106
106 -
 107
107 -
 108
108 -
 109
109 -
110
-
111
-
112
-
113
-
114
-
115
-
116
-
117
-
118
-
119
-
120
-
121
-
122
-
123
-
124
-
125
-
126
-
127
-
128
-
129
-
130
-
131
-
132
-
133
-
134
-
135
-
136
-
137
-
138
-
139
-
140
-
141
-
142
-
143
-
144
-
145
-
146
-
147
-
148
 |
 |

Management’s Discussion (Continued)
Utilities and Energy (“Berkshire Hathaway Energy Company”) (Continued)
Natural Gas Pipelines
Natural gas pipeline revenues increased $122 million (13%) in 2014 compared to 2013. The increase reflected
comparatively higher revenues from increased natural gas rates and volumes as a result of significantly colder weather
conditions in the first quarter of 2014 in Northern Natural Gas Company’s service territory and system rebalancing activities
over the first half of 2014. EBIT in 2014 of $379 million were relatively unchanged from 2013. Revenues and EBIT in 2013
were $971 million and $385 million, respectively, and were relatively unchanged from 2012.
Other energy businesses
Revenues and EBIT in 2014 from other energy businesses increased $408 million and $232 million, respectively, over
revenues and EBIT in 2013. The increases were primarily attributable to increased revenues from new solar facilities as
additional assets were placed in service and from the inclusion of revenues and EBIT of AltaLink for the month of December.
The increase in revenues from other activities in 2013 was $81 million, which was primarily attributable to revenues from the
new solar and wind-powered facilities, partially offset by the impact of one-time customer refunds issued by NV Energy and
impairment losses associated with BHE’s interests in certain geothermal electricity generation projects. EBIT from other
activities declined $87 million in 2013 compared to 2012, as the impacts of the aforementioned losses associated with
geothermal projects and NV Energy acquisition costs and customer refunds, more than offset the increase in earnings from the
new solar and wind-powered electricity generation projects.
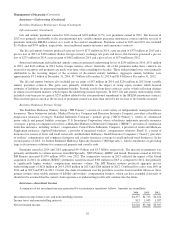
Real estate brokerage
Revenues of the real estate brokerage businesses increased $339 million (19%) in 2014 as compared to 2013. The increase
reflected the impact of revenues from acquired businesses, partially offset by lower revenues from existing operations, due to a
6% decline in closed units and lower franchise revenues. EBIT of $139 million in 2014 were unchanged from 2013 as the
increases in EBIT from acquired businesses were offset by lower EBIT from existing businesses and higher operating expenses
related to “Berkshire Hathaway HomeServices” rebranding activities.
Real estate brokerage revenues in 2013 increased $489 million (37%) over 2012, while EBIT increased $57 million
(70%) versus 2012. The increases in revenues and EBIT were attributable to increases in closed brokerage transactions and
higher average home sales prices from existing business and the impact of businesses acquired during the previous two years.
Corporate interest and income taxes
Corporate interest includes interest on unsecured debt issued by BHE and borrowings from certain Berkshire insurance
subsidiaries. In 2014, corporate interest expense increased due to new borrowings in connection with the NV Energy and
AltaLink acquisitions. BHE’s consolidated effective income tax rates were 23% in 2014, 7% in 2013 and 9% in 2012. In each
year, BHE’s income tax rates reflect significant production tax credits from wind-powered electricity generation in the United
States. In addition, pre-tax earnings of Northern Powergrid are taxed at a lower statutory tax rate in the United Kingdom
compared to the statutory tax rate in the United States. BHE’s effective rate was reduced in 2013 due to a reduction of deferred
income tax liabilities as a result of enacted statutory income tax rate decreases in the United Kingdom.
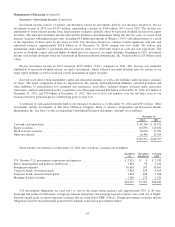
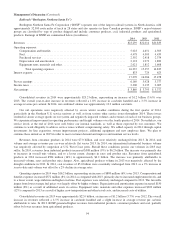
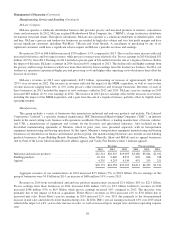
Manufacturing, Service and Retailing
A summary of revenues and earnings of our manufacturing, service and retailing businesses follows. Amounts are
in millions.
Revenues Earnings
2014 2013 2012 2014 2013 2012
McLane Company ........................................ $46,640 $45,930 $37,437 $ 435 $ 486 $ 403
Manufacturing ........................................... 36,773 34,258 32,105 4,811 4,205 3,911
Service ................................................. 9,854 8,996 8,175 1,202 1,093 966
Retailing ............................................... 4,422 4,288 3,715 344 376 306
$97,689 $93,472 $81,432
Pre-tax earnings .......................................... 6,792 6,160 5,586
Income taxes and noncontrolling interests ..................... 2,324 2,283 2,229
$4,468 $3,877 $3,357
97