Berkshire Hathaway 2014 Annual Report Download - page 76
Download and view the complete annual report
Please find page 76 of the 2014 Berkshire Hathaway annual report below. You can navigate through the pages in the report by either clicking on the pages listed below, or by using the keyword search tool below to find specific information within the annual report.-
 1
1 -
2
-
3
-
4
-
5
-
6
-
7
-
8
-
9
-
10
-
11
-
12
-
13
-
14
-
15
-
16
-
17
-
18
-
19
-
20
-
21
-
22
-
23
-
24
-
25
-
26
-
27
-
28
-
29
-
30
-
31
-
32
-
33
-
34
-
35
-
36
-
37
-
38
-
39
-
40
-
41
-
42
-
43
-
44
-
45
-
46
-
47
-
48
-
49
-
50
-
51
-
52
-
53
-
54
-
55
-
56
-
57
-
58
-
59
-
60
-
61
-
62
-
63
-
64
-
65
-
 66
66 -
 67
67 -
 68
68 -
 69
69 -
 70
70 -
 71
71 -
 72
72 -
 73
73 -
 74
74 -
 75
75 -
 76
76 -
 77
77 -
 78
78 -
 79
79 -
 80
80 -
 81
81 -
 82
82 -
 83
83 -
 84
84 -
 85
85 -
 86
86 -
87
-
88
-
89
-
90
-
91
-
92
-
93
-
94
-
95
-
96
-
97
-
98
-
99
-
100
-
101
-
102
-
103
-
104
-
105
-
106
-
107
-
108
-
109
-
110
-
111
-
112
-
113
-
114
-
115
-
116
-
117
-
118
-
119
-
120
-
121
-
122
-
123
-
124
-
125
-
126
-
127
-
128
-
129
-
130
-
131
-
132
-
133
-
134
-
135
-
136
-
137
-
138
-
139
-
140
-
141
-
142
-
143
-
144
-
145
-
146
-
147
-
148
 |
 |

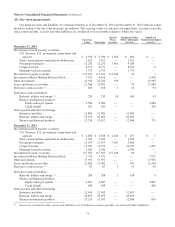
Notes to Consolidated Financial Statements (Continued)
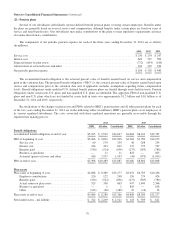
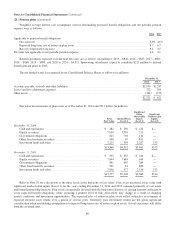
(18) Fair value measurements
Our financial assets and liabilities are summarized below as of December 31, 2014 and December 31, 2013 with fair values
shown according to the fair value hierarchy (in millions). The carrying values of cash and cash equivalents, accounts receivable
and accounts payable, accruals and other liabilities are considered to be reasonable estimates of their fair values.
Carrying
Value Fair Value
Quoted
Prices
(Level 1)
Significant Other
Observable Inputs
(Level 2)
Significant
Unobservable Inputs
(Level 3)
December 31, 2014
Investments in fixed maturity securities:
U.S. Treasury, U.S. government corporations and
agencies ................................ $ 2,930 $ 2,930 $ 2,264 $ 666 $ —
States, municipalities and political subdivisions . . . 1,912 1,912 — 1,912 —
Foreign governments ........................ 12,270 12,270 7,981 4,289 —
Corporate bonds ............................ 8,771 8,771 — 8,763 8
Mortgage-backed securities ................... 1,753 1,753 — 1,753 —
Investments in equity securities .................... 117,470 117,470 117,424 45 1
Investment in Heinz Holding Preferred Stock ......... 7,710 8,416 — — 8,416
Other investments ............................... 22,324 22,324 329 — 21,995
Loans and finance receivables ..................... 12,566 12,891 — 33 12,858
Derivative contract assets (1) ....................... 108 108 1 13 94
Derivative contract liabilities:
Railroad, utilities and energy (1) ................ 230 230 18 169 43
Finance and financial products:
Equity index put options .................. 4,560 4,560 — — 4,560
Credit default .......................... 250 250 — — 250
Notes payable and other borrowings:
Insurance and other ......................... 11,894 12,484 — 12,484 —
Railroad, utilities and energy .................. 55,579 62,802 — 62,802 —
Finance and financial products ................. 12,736 13,417 — 12,846 571
December 31, 2013
Investments in fixed maturity securities:
U.S. Treasury, U.S. government corporations and
agencies ................................ $ 2,658 $ 2,658 $ 2,184 $ 473 $ 1
States, municipalities and political subdivisions . . . 2,345 2,345 — 2,345 —
Foreign governments ........................ 11,073 11,073 7,467 3,606 —
Corporate bonds ............................ 11,237 11,254 — 10,187 1,067
Mortgage-backed securities ................... 2,040 2,040 — 2,040 —
Investments in equity securities .................... 117,505 117,505 117,438 60 7
Investment in Heinz Holding Preferred Stock ......... 7,710 7,971 — — 7,971
Other investments ............................... 17,951 17,951 — — 17,951
Loans and finance receivables ..................... 12,826 12,002 — 454 11,548
Derivative contract assets (1) ....................... 87 87 3 15 69
Derivative contract liabilities:
Railroad, utilities and energy (1) ................ 208 208 1 198 9
Finance and financial products:
Equity index put options .................. 4,667 4,667 — — 4,667
Credit default .......................... 648 648 — — 648
Notes payable and other borrowings:
Insurance and other ......................... 12,440 12,655 — 12,655 —
Railroad, utilities and energy .................. 46,655 49,879 — 49,879 —
Finance and financial products ................. 13,129 13,505 — 12,846 659
(1) Assets are included in other assets and liabilities are included in accounts payable, accruals and other liabilities.
74