Berkshire Hathaway 2014 Annual Report Download - page 51
Download and view the complete annual report
Please find page 51 of the 2014 Berkshire Hathaway annual report below. You can navigate through the pages in the report by either clicking on the pages listed below, or by using the keyword search tool below to find specific information within the annual report.-
 1
1 -
2
-
3
-
4
-
5
-
6
-
7
-
8
-
9
-
10
-
11
-
12
-
13
-
14
-
15
-
16
-
17
-
18
-
19
-
20
-
21
-
22
-
23
-
24
-
25
-
26
-
27
-
28
-
29
-
30
-
31
-
32
-
33
-
34
-
35
-
36
-
37
-
38
-
39
-
40
-
 41
41 -
 42
42 -
 43
43 -
 44
44 -
 45
45 -
 46
46 -
 47
47 -
 48
48 -
 49
49 -
 50
50 -
 51
51 -
 52
52 -
 53
53 -
 54
54 -
 55
55 -
 56
56 -
 57
57 -
 58
58 -
 59
59 -
 60
60 -
 61
61 -
62
-
63
-
64
-
65
-
66
-
67
-
68
-
69
-
70
-
71
-
72
-
73
-
74
-
75
-
76
-
77
-
78
-
79
-
80
-
81
-
82
-
83
-
84
-
85
-
86
-
87
-
88
-
89
-
90
-
91
-
92
-
93
-
94
-
95
-
96
-
97
-
98
-
99
-
100
-
101
-
102
-
103
-
104
-
105
-
106
-
107
-
108
-
109
-
110
-
111
-
112
-
113
-
114
-
115
-
116
-
117
-
118
-
119
-
120
-
121
-
122
-
123
-
124
-
125
-
126
-
127
-
128
-
129
-
130
-
131
-
132
-
133
-
134
-
135
-
136
-
137
-
138
-
139
-
140
-
141
-
142
-
143
-
144
-
145
-
146
-
147
-
148
 |
 |

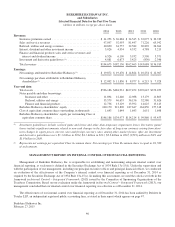
BERKSHIRE HATHAWAY INC.
and Subsidiaries
CONSOLIDATED STATEMENTS OF EARNINGS
(dollars in millions except per-share amounts)
Year Ended December 31,
2014 2013 2012
Revenues:
Insurance and Other:
Insurance premiums earned ...................................................... $ 41,253 $ 36,684 $ 34,545
Sales and service revenues ....................................................... 97,097 92,993 81,447
Interest, dividend and other investment income ....................................... 5,026 4,934 4,532
Investment gains/losses .......................................................... 3,503 3,881 990
146,879 138,492 121,514
Railroad, Utilities and Energy:
Revenues ..................................................................... 40,690 34,757 32,582
Finance and Financial Products:
Sales and service revenues ....................................................... 5,094 4,635 4,358
Interest, dividend and other investment income ....................................... 1,432 1,474 1,574
Investment gains/losses .......................................................... 72 184 472
Derivative gains/losses .......................................................... 506 2,608 1,963
7,104 8,901 8,367
194,673 182,150 162,463
Costs and expenses:
Insurance and Other:
Insurance losses and loss adjustment expenses ....................................... 26,406 21,275 20,113
Life, annuity and health insurance benefits .......................................... 5,181 5,072 5,114
Insurance underwriting expenses .................................................. 6,998 7,248 7,693
Cost of sales and services ........................................................ 78,873 75,953 66,419
Selling, general and administrative expenses ......................................... 12,198 11,732 10,307
Interest expense ................................................................ 419 395 363
130,075 121,675 110,009
Railroad, Utilities and Energy:
Cost of sales and operating expenses ............................................... 29,378 25,157 23,816
Interest expense ................................................................ 2,378 1,865 1,745
31,756 27,022 25,561
Finance and Financial Products:
Cost of sales and services ........................................................ 2,758 2,566 2,458
Selling, general and administrative expenses ......................................... 1,523 1,550 1,563
Interest expense ................................................................ 456 541 636
4,737 4,657 4,657
166,568 153,354 140,227
Earnings before income taxes ....................................................... 28,105 28,796 22,236
Income tax expense ............................................................. 7,935 8,951 6,924
Net earnings ...................................................................... 20,170 19,845 15,312
Less: Earnings attributable to noncontrolling interests .................................. 298 369 488
Net earnings attributable to Berkshire Hathaway shareholders ........................... $ 19,872 $ 19,476 $ 14,824
Average common shares outstanding * ............................................. 1,643,456 1,643,613 1,651,294
Net earnings per share attributable to Berkshire Hathaway shareholders * ................. $ 12,092 $ 11,850 $ 8,977
* Average shares outstanding include average Class A common shares and average Class B common shares determined on an equivalent
Class A common stock basis. Net earnings per common share attributable to Berkshire Hathaway shown above represents net earnings per
equivalent Class A common share. Net earnings per Class B common share is equal to one-fifteen-hundredth (1/1,500) of such amount or
$8.06 per share for 2014, $7.90 per share for 2013 and $5.98 per share for 2012.
See accompanying Notes to Consolidated Financial Statements
49