Berkshire Hathaway 2014 Annual Report Download - page 98
Download and view the complete annual report
Please find page 98 of the 2014 Berkshire Hathaway annual report below. You can navigate through the pages in the report by either clicking on the pages listed below, or by using the keyword search tool below to find specific information within the annual report.-
 1
1 -
2
-
3
-
4
-
5
-
6
-
7
-
8
-
9
-
10
-
11
-
12
-
13
-
14
-
15
-
16
-
17
-
18
-
19
-
20
-
21
-
22
-
23
-
24
-
25
-
26
-
27
-
28
-
29
-
30
-
31
-
32
-
33
-
34
-
35
-
36
-
37
-
38
-
39
-
40
-
41
-
42
-
43
-
44
-
45
-
46
-
47
-
48
-
49
-
50
-
51
-
52
-
53
-
54
-
55
-
56
-
57
-
58
-
59
-
60
-
61
-
62
-
63
-
64
-
65
-
66
-
67
-
68
-
69
-
70
-
71
-
72
-
73
-
74
-
75
-
76
-
77
-
78
-
79
-
80
-
81
-
82
-
83
-
84
-
85
-
86
-
87
-
 88
88 -
 89
89 -
 90
90 -
 91
91 -
 92
92 -
 93
93 -
 94
94 -
 95
95 -
 96
96 -
 97
97 -
 98
98 -
 99
99 -
 100
100 -
 101
101 -
 102
102 -
 103
103 -
 104
104 -
 105
105 -
 106
106 -
 107
107 -
 108
108 -
109
-
110
-
111
-
112
-
113
-
114
-
115
-
116
-
117
-
118
-
119
-
120
-
121
-
122
-
123
-
124
-
125
-
126
-
127
-
128
-
129
-
130
-
131
-
132
-
133
-
134
-
135
-
136
-
137
-
138
-
139
-
140
-
141
-
142
-
143
-
144
-
145
-
146
-
147
-
148
 |
 |
Management’s Discussion (Continued)
Utilities and Energy (“Berkshire Hathaway Energy Company”) (Continued)
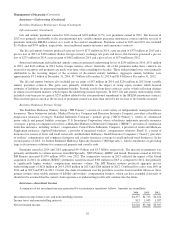
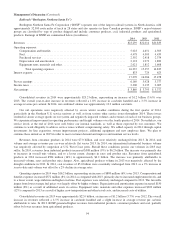
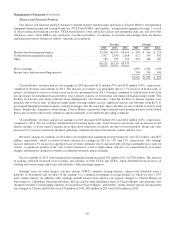
PacifiCorp
PacifiCorp operates a regulated utility business in portions of several Western states, including Utah, Oregon and
Wyoming. Revenues in 2014 were $5.3 billion, an increase of $100 million (2%) compared to revenues in 2013. In 2014,
revenues increased primarily due to higher rates, partially offset by lower retail customer load. PacifiCorp’s EBIT were $1.0
billion, an increase of $28 million (3%) over 2013. The increase in EBIT reflected the impact of the increase in operating
revenues and the recognition of estimated insurance recoveries from a fire loss as compared to a reduction in 2013 EBIT from
charges related to the fire, partially offset by increased energy costs and higher depreciation expense. The increase in
depreciation expense reflected the impact of changes in depreciation rates and higher plant in service, including a new
generation facility.
Revenues in 2013 were $5.2 billion, an increase of $265 million (5%) compared to 2012. The increase was primarily due to
higher retail revenues of $337 million, partially offset by lower renewable energy credits of $74 million. The increase in retail
revenues reflected higher prices approved by regulators and higher retail customer loads. EBIT in 2013 were $982 million, an
increase of $245 million (33%) compared to 2012. The comparative increase in EBIT was primarily due to charges of $165
million in 2012 related to litigation, fire and other damage claims, and, to a lesser extent, the increase in revenues. Before the
impact of the aforementioned claims, EBIT in 2013 as a percentage of revenues were relatively unchanged from 2012.
MEC
MEC operates a regulated utility business primarily in Iowa and Illinois. Revenues in 2014 increased $365 million
(11%) to $3.8 billion. In 2014, revenues from regulated natural gas increased $172 million compared to 2013. The increase in
regulated natural gas revenues was driven by higher per-unit natural gas costs, which are recovered from customers via
adjustment clauses, and higher volumes attributable to colder weather in the first quarter of 2014. Regulated electric revenues
increased $55 million compared to 2013 and was primarily due to increased retail rates. Nonregulated revenues increased $122
million compared to 2013 due to higher natural gas and electricity prices and higher electricity volumes, partly offset by lower
natural gas volumes. EBIT were $298 million in 2014, an increase of $68 million (30%) compared to 2013. The comparative
increase in EBIT was primarily due to increased earnings from the regulated electric business, reflecting the impact of higher
revenues and lower depreciation and amortization expense due to the impact of depreciation rate changes, partially offset by
increased energy and operating costs.
Revenues in 2013 increased $178 million (5%) over 2012. The increase in revenues reflected higher regulated electric and
natural gas revenues and lower nonregulated and other revenues. Regulated retail electric revenues increased $82 million, while
regulated natural gas revenues increased $165 million compared to 2012. The increase in regulated electric revenues was
primarily due to higher regulatory rates in Iowa and Illinois and increases in retail customer load. The increase in regulated
natural gas revenues was primarily due to higher retail volumes and increases in recoveries through adjustment clauses as a
result of a higher average per-unit cost of gas sold. Nonregulated and other operating revenues declined $67 million compared
to 2012 primarily due to lower electricity volumes and prices. EBIT declined $6 million in 2013 compared to 2012, reflecting
lower regulated and nonregulated electric operating earnings, partially offset by higher natural gas earnings.
NV Energy
BHE acquired NV Energy on December 19, 2013, and its results are included in our consolidated results beginning as of
that date. In 2014, revenues and EBIT were $3.3 billion and $549 million, respectively. In 2013, NV Energy’s results for the
December 19 through 31, 2013 period were included in other energy businesses and reflected one-time customer refunds,
acquisition costs and other charges arising from the acquisition. NV Energy’s revenues and EBIT are normally higher in the
second and third quarters due to higher electricity consumption in its service territories.
Northern Powergrid
Northern Powergrid’s revenues of $1.3 billion in 2014 increased $258 million (25%) as compared to 2013. EBIT were
$527 million in 2014, an increase of $165 million (46%) compared to 2013. The increases in revenues and EBIT were due
mainly to increased distribution revenues from increased rates and favorable regulatory provisions and the favorable impact of
foreign currency translation.
In 2013, revenues declined $10 million (1%) compared to 2012. EBIT in 2013 was $362 million, a decline of $67 million
versus 2012. EBIT were negatively impacted by fourth quarter rebates to customers and higher regulatory rate provisions, which
reduced revenues, and from higher distribution operating expenses and the unfavorable effect of foreign currency translation in
2013. Operating expenses in 2013 included comparatively higher pension costs and higher depreciation expenses. EBIT in 2013
also included a $9 million loss from the write-off of hydrocarbon well exploration costs.
96