Berkshire Hathaway 2014 Annual Report Download - page 20
Download and view the complete annual report
Please find page 20 of the 2014 Berkshire Hathaway annual report below. You can navigate through the pages in the report by either clicking on the pages listed below, or by using the keyword search tool below to find specific information within the annual report.-
 1
1 -
2
-
3
-
4
-
5
-
6
-
7
-
8
-
9
-
 10
10 -
 11
11 -
 12
12 -
 13
13 -
 14
14 -
 15
15 -
 16
16 -
 17
17 -
 18
18 -
 19
19 -
 20
20 -
 21
21 -
 22
22 -
 23
23 -
 24
24 -
 25
25 -
 26
26 -
 27
27 -
 28
28 -
 29
29 -
 30
30 -
31
-
32
-
33
-
34
-
35
-
36
-
37
-
38
-
39
-
40
-
41
-
42
-
43
-
44
-
45
-
46
-
47
-
48
-
49
-
50
-
51
-
52
-
53
-
54
-
55
-
56
-
57
-
58
-
59
-
60
-
61
-
62
-
63
-
64
-
65
-
66
-
67
-
68
-
69
-
70
-
71
-
72
-
73
-
74
-
75
-
76
-
77
-
78
-
79
-
80
-
81
-
82
-
83
-
84
-
85
-
86
-
87
-
88
-
89
-
90
-
91
-
92
-
93
-
94
-
95
-
96
-
97
-
98
-
99
-
100
-
101
-
102
-
103
-
104
-
105
-
106
-
107
-
108
-
109
-
110
-
111
-
112
-
113
-
114
-
115
-
116
-
117
-
118
-
119
-
120
-
121
-
122
-
123
-
124
-
125
-
126
-
127
-
128
-
129
-
130
-
131
-
132
-
133
-
134
-
135
-
136
-
137
-
138
-
139
-
140
-
141
-
142
-
143
-
144
-
145
-
146
-
147
-
148
 |
 |
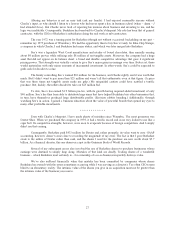
In 2013, I soured somewhat on the company’s then-management and sold 114 million shares, realizing a
profit of $43 million. My leisurely pace in making sales would prove expensive. Charlie calls this sort of behavior
“thumb-sucking.” (Considering what my delay cost us, he is being kind.)
During 2014, Tesco’s problems worsened by the month. The company’s market share fell, its margins
contracted and accounting problems surfaced. In the world of business, bad news often surfaces serially: You see a
cockroach in your kitchen; as the days go by, you meet his relatives.
We sold Tesco shares throughout the year and are now out of the position. (The company, we should
mention, has hired new management, and we wish them well.) Our after-tax loss from this investment was $444
million, about 1/5 of 1% of Berkshire’s net worth. In the past 50 years, we have only once realized an investment
loss that at the time of sale cost us 2% of our net worth. Twice, we experienced 1% losses. All three of these losses
occurred in the 1974-1975 period, when we sold stocks that were very cheap in order to buy others we believed to
be even cheaper.
************
Our investment results have been helped by a terrific tailwind. During the 1964-2014 period, the S&P 500
rose from 84 to 2,059, which, with reinvested dividends, generated the overall return of 11,196% shown on page 2.
Concurrently, the purchasing power of the dollar declined a staggering 87%. That decrease means that it now takes
$1 to buy what could be bought for 13¢ in 1965 (as measured by the Consumer Price Index).
There is an important message for investors in that disparate performance between stocks and dollars.
Think back to our 2011 annual report, in which we defined investing as “the transfer to others of purchasing power
now with the reasoned expectation of receiving more purchasing power – after taxes have been paid on nominal
gains – in the future.”
The unconventional, but inescapable, conclusion to be drawn from the past fifty years is that it has been far
safer to invest in a diversified collection of American businesses than to invest in securities – Treasuries, for
example – whose values have been tied to American currency. That was also true in the preceding half-century, a
period including the Great Depression and two world wars. Investors should heed this history. To one degree or
another it is almost certain to be repeated during the next century.
Stock prices will always be far more volatile than cash-equivalent holdings. Over the long term, however,
currency-denominated instruments are riskier investments – far riskier investments – than widely-diversified stock
portfolios that are bought over time and that are owned in a manner invoking only token fees and commissions. That
lesson has not customarily been taught in business schools, where volatility is almost universally used as a proxy for
risk. Though this pedagogic assumption makes for easy teaching, it is dead wrong: Volatility is far from
synonymous with risk. Popular formulas that equate the two terms lead students, investors and CEOs astray.
It is true, of course, that owning equities for a day or a week or a year is far riskier (in both nominal and
purchasing-power terms) than leaving funds in cash-equivalents. That is relevant to certain investors – say,
investment banks – whose viability can be threatened by declines in asset prices and which might be forced to sell
securities during depressed markets. Additionally, any party that might have meaningful near-term needs for funds
should keep appropriate sums in Treasuries or insured bank deposits.
For the great majority of investors, however, who can – and should – invest with a multi-decade horizon,
quotational declines are unimportant. Their focus should remain fixed on attaining significant gains in purchasing
power over their investing lifetime. For them, a diversified equity portfolio, bought over time, will prove far less
risky than dollar-based securities.
18