Berkshire Hathaway 2014 Annual Report Download - page 116
Download and view the complete annual report
Please find page 116 of the 2014 Berkshire Hathaway annual report below. You can navigate through the pages in the report by either clicking on the pages listed below, or by using the keyword search tool below to find specific information within the annual report.-
 1
1 -
2
-
3
-
4
-
5
-
6
-
7
-
8
-
9
-
10
-
11
-
12
-
13
-
14
-
15
-
16
-
17
-
18
-
19
-
20
-
21
-
22
-
23
-
24
-
25
-
26
-
27
-
28
-
29
-
30
-
31
-
32
-
33
-
34
-
35
-
36
-
37
-
38
-
39
-
40
-
41
-
42
-
43
-
44
-
45
-
46
-
47
-
48
-
49
-
50
-
51
-
52
-
53
-
54
-
55
-
56
-
57
-
58
-
59
-
60
-
61
-
62
-
63
-
64
-
65
-
66
-
67
-
68
-
69
-
70
-
71
-
72
-
73
-
74
-
75
-
76
-
77
-
78
-
79
-
80
-
81
-
82
-
83
-
84
-
85
-
86
-
87
-
88
-
89
-
90
-
91
-
92
-
93
-
94
-
95
-
96
-
97
-
98
-
99
-
100
-
101
-
102
-
103
-
104
-
105
-
 106
106 -
 107
107 -
 108
108 -
 109
109 -
 110
110 -
 111
111 -
 112
112 -
 113
113 -
 114
114 -
 115
115 -
 116
116 -
 117
117 -
 118
118 -
 119
119 -
 120
120 -
 121
121 -
 122
122 -
 123
123 -
 124
124 -
 125
125 -
 126
126 -
127
-
128
-
129
-
130
-
131
-
132
-
133
-
134
-
135
-
136
-
137
-
138
-
139
-
140
-
141
-
142
-
143
-
144
-
145
-
146
-
147
-
148
 |
 |

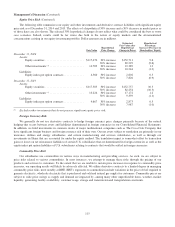
Management’s Discussion (Continued)
Interest Rate Risk (Continued)
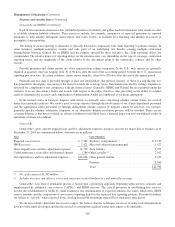
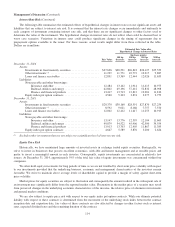
The following table summarizes the estimated effects of hypothetical changes in interest rates on our significant assets and
liabilities that are subject to interest rate risk. It is assumed that the interest rate changes occur immediately and uniformly to
each category of instrument containing interest rate risk, and that there are no significant changes to other factors used to
determine the value of the instrument. The hypothetical changes in interest rates do not reflect what could be deemed best or
worst case scenarios. Variations in interest rates could produce significant changes in the timing of repayments due to
prepayment options available to the issuer. For these reasons, actual results might differ from those reflected in the table.
Dollars are in millions.
Estimated Fair Value after
Hypothetical Change in Interest Rates
(bp=basis points)
Fair Value
100 bp
decrease
100 bp
increase
200 bp
increase
300 bp
increase
December 31, 2014
Assets:
Investments in fixed maturity securities ................... $27,636 $28,291 $26,843 $26,127 $25,529
Other investments (1) .................................. 11,239 11,771 10,772 10,317 9,887
Loans and finance receivables ........................... 12,891 13,369 12,444 12,026 11,633
Liabilities:
Notes payable and other borrowings:
Insurance and other ............................... 12,484 13,142 11,914 11,415 10,973
Railroad, utilities and energy ........................ 62,802 69,196 57,412 52,832 48,908
Finance and financial products ...................... 13,417 13,713 12,812 12,281 11,810
Equity index put option contracts ........................ 4,560 5,343 3,874 3,277 2,759
December 31, 2013
Assets:
Investments in fixed maturity securities ................... $29,370 $30,160 $28,591 $27,870 $27,259
Other investments (1) .................................. 8,592 9,021 8,166 7,757 7,370
Loans and finance receivables ........................... 12,002 12,412 11,617 11,255 10,915
Liabilities:
Notes payable and other borrowings:
Insurance and other ............................... 13,147 13,776 12,595 12,104 11,663
Railroad, utilities and energy ........................ 49,879 54,522 45,906 42,500 39,554
Finance and financial products ...................... 13,013 13,703 12,405 11,867 11,385
Equity index put option contracts ........................ 4,667 5,589 3,876 3,200 2,626
(1) Excludes other investments that are not subject to a significant level of interest rate risk.
Equity Price Risk
Historically, we have maintained large amounts of invested assets in exchange traded equity securities. Strategically, we
strive to invest in businesses that possess excellent economics, with able and honest management and at sensible prices and
prefer to invest a meaningful amount in each investee. Consequently, equity investments are concentrated in relatively few
issuers. At December 31, 2014, approximately 59% of the total fair value of equity investments was concentrated within four
companies.
We often hold equity investments for long periods of time so we are not troubled by short-term price volatility with respect
to our investments provided that the underlying business, economic and management characteristics of the investees remain
favorable. We strive to maintain above average levels of shareholder capital to provide a margin of safety against short-term
price volatility.
Market prices for equity securities are subject to fluctuation and consequently the amount realized in the subsequent sale of
an investment may significantly differ from the reported market value. Fluctuation in the market price of a security may result
from perceived changes in the underlying economic characteristics of the investee, the relative price of alternative investments
and general market conditions.
We are also subject to equity price risk with respect to our equity index put option contracts. While our ultimate potential
liability with respect to these contracts is determined from the movement of the underlying stock index between the contract
inception date and expiration date, fair values of these contracts are also affected by changes in other factors such as interest
rates, expected dividend rates and the remaining duration of the contract.
114