Berkshire Hathaway 2014 Annual Report Download - page 63
Download and view the complete annual report
Please find page 63 of the 2014 Berkshire Hathaway annual report below. You can navigate through the pages in the report by either clicking on the pages listed below, or by using the keyword search tool below to find specific information within the annual report.-
 1
1 -
2
-
3
-
4
-
5
-
6
-
7
-
8
-
9
-
10
-
11
-
12
-
13
-
14
-
15
-
16
-
17
-
18
-
19
-
20
-
21
-
22
-
23
-
24
-
25
-
26
-
27
-
28
-
29
-
30
-
31
-
32
-
33
-
34
-
35
-
36
-
37
-
38
-
39
-
40
-
41
-
42
-
43
-
44
-
45
-
46
-
47
-
48
-
49
-
50
-
51
-
52
-
 53
53 -
 54
54 -
 55
55 -
 56
56 -
 57
57 -
 58
58 -
 59
59 -
 60
60 -
 61
61 -
 62
62 -
 63
63 -
 64
64 -
 65
65 -
 66
66 -
 67
67 -
 68
68 -
 69
69 -
 70
70 -
 71
71 -
 72
72 -
 73
73 -
74
-
75
-
76
-
77
-
78
-
79
-
80
-
81
-
82
-
83
-
84
-
85
-
86
-
87
-
88
-
89
-
90
-
91
-
92
-
93
-
94
-
95
-
96
-
97
-
98
-
99
-
100
-
101
-
102
-
103
-
104
-
105
-
106
-
107
-
108
-
109
-
110
-
111
-
112
-
113
-
114
-
115
-
116
-
117
-
118
-
119
-
120
-
121
-
122
-
123
-
124
-
125
-
126
-
127
-
128
-
129
-
130
-
131
-
132
-
133
-
134
-
135
-
136
-
137
-
138
-
139
-
140
-
141
-
142
-
143
-
144
-
145
-
146
-
147
-
148
 |
 |

Notes to Consolidated Financial Statements (Continued)
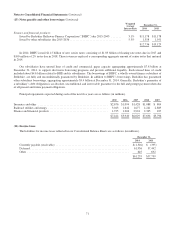
(3) Investments in fixed maturity securities (Continued)
The amortized cost and estimated fair value of securities with fixed maturities at December 31, 2014 are summarized
below by contractual maturity dates. Actual maturities will differ from contractual maturities because issuers of certain of the
securities retain early call or prepayment rights. Amounts are in millions.
Due in one
year or less
Due after one
year through
five years
Due after five
years through
ten years
Due after
ten years
Mortgage-backed
securities Total
Amortized cost ........................... $7,650 $11,341 $2,782 $2,695 $1,555 $26,023
Fair value ............................... 7,585 11,994 3,009 3,295 1,753 27,636
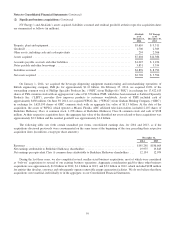
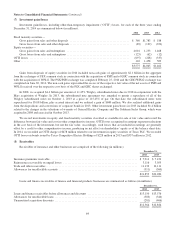
(4) Investments in equity securities
Investments in equity securities as of December 31, 2014 and 2013 are summarized based on the primary industry of the
investee in the table below (in millions).
Cost Basis
Unrealized
Gains
Unrealized
Losses
Fair
Value
December 31, 2014 *
Banks, insurance and finance .......................................... $22,495 $33,170 $ — $ 55,665
Consumer products .................................................. 6,951 18,389 (1) 25,339
Commercial, industrial and other ....................................... 28,924 8,578 (1,036) 36,466
$58,370 $60,137 $(1,037) $117,470
* Approximately 59% of the aggregate fair value was concentrated in the equity securities of four companies (American
Express Company – $14.1 billion; Wells Fargo & Company – $26.5 billion; International Business Machines Corporation –
$12.3 billion; and The Coca-Cola Company – $16.9 billion).
Cost Basis
Unrealized
Gains
Unrealized
Losses
Fair
Value
December 31, 2013 *
Banks, insurance and finance .......................................... $22,420 $28,021 $ — $ 50,441
Consumer products .................................................. 7,082 17,854 — 24,936
Commercial, industrial and other ....................................... 29,949 12,322 (143) 42,128
$59,451 $58,197 $(143) $117,505
* Approximately 55% of the aggregate fair value was concentrated in the equity securities of four companies (American
Express Company – $13.8 billion; Wells Fargo & Company – $21.9 billion; International Business Machines Corporation –
$12.8 billion; and The Coca-Cola Company – $16.5 billion).
As of December 31, 2014 and 2013, we concluded that there were no unrealized losses that were other than temporary. Our
conclusions were based on: (a) our ability and intent to hold the securities to recovery; (b) our assessment that the underlying
business and financial condition of each of these issuers was favorable; (c) our opinion that the relative price declines were not
significant; and (d) our belief that market prices will increase to and exceed our cost. As of December 31, 2014 and 2013,
unrealized losses on equity securities in a continuous unrealized loss position for more than twelve consecutive months were
$65 million and $52 million, respectively.
61