Berkshire Hathaway 2014 Annual Report Download - page 91
Download and view the complete annual report
Please find page 91 of the 2014 Berkshire Hathaway annual report below. You can navigate through the pages in the report by either clicking on the pages listed below, or by using the keyword search tool below to find specific information within the annual report.-
 1
1 -
2
-
3
-
4
-
5
-
6
-
7
-
8
-
9
-
10
-
11
-
12
-
13
-
14
-
15
-
16
-
17
-
18
-
19
-
20
-
21
-
22
-
23
-
24
-
25
-
26
-
27
-
28
-
29
-
30
-
31
-
32
-
33
-
34
-
35
-
36
-
37
-
38
-
39
-
40
-
41
-
42
-
43
-
44
-
45
-
46
-
47
-
48
-
49
-
50
-
51
-
52
-
53
-
54
-
55
-
56
-
57
-
58
-
59
-
60
-
61
-
62
-
63
-
64
-
65
-
66
-
67
-
68
-
69
-
70
-
71
-
72
-
73
-
74
-
75
-
76
-
77
-
78
-
79
-
80
-
 81
81 -
 82
82 -
 83
83 -
 84
84 -
 85
85 -
 86
86 -
 87
87 -
 88
88 -
 89
89 -
 90
90 -
 91
91 -
 92
92 -
 93
93 -
 94
94 -
 95
95 -
 96
96 -
 97
97 -
 98
98 -
 99
99 -
 100
100 -
 101
101 -
102
-
103
-
104
-
105
-
106
-
107
-
108
-
109
-
110
-
111
-
112
-
113
-
114
-
115
-
116
-
117
-
118
-
119
-
120
-
121
-
122
-
123
-
124
-
125
-
126
-
127
-
128
-
129
-
130
-
131
-
132
-
133
-
134
-
135
-
136
-
137
-
138
-
139
-
140
-
141
-
142
-
143
-
144
-
145
-
146
-
147
-
148
 |
 |

Management’s Discussion (Continued)
Insurance—Underwriting (Continued)
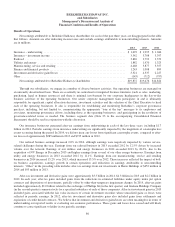
General Re
Through General Re, we conduct a reinsurance business offering property and casualty and life and health coverages to
clients worldwide. We write property and casualty reinsurance in North America on a direct basis through General Reinsurance
Corporation and internationally through Germany-based General Reinsurance AG and other wholly-owned affiliates. Property
and casualty reinsurance is also written in broker markets through Faraday in London. Life and health reinsurance is written in
North America through General Re Life Corporation and internationally through General Reinsurance AG. General Re strives to
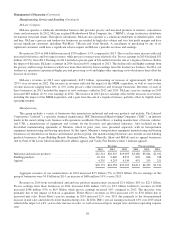
generate underwriting profits in essentially all of its product lines. Our management does not evaluate underwriting performance
based upon market share and our underwriters are instructed to reject inadequately priced risks. General Re’s underwriting
results are summarized in the following table. Amounts are in millions.
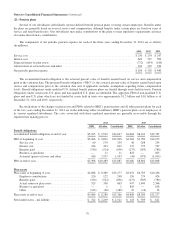
Premiums written Premiums earned Pre-tax underwriting gain (loss)
2014 2013 2012 2014 2013 2012 2014 2013 2012
Property/casualty .................. $3,257 $2,972 $2,982 $3,103 $3,007 $2,904 $170 $148 $399
Life/health ........................ 3,161 2,991 3,002 3,161 2,977 2,966 107 135 (44)
$6,418 $5,963 $5,984 $6,264 $5,984 $5,870 $277 $283 $355
Property/casualty
Property/casualty premiums written and earned in 2014 increased $285 million (9.6%) and $96 million (3.2%),
respectively, compared to 2013. Adjusting for changes in foreign currency exchange rates, the increases in premiums written
and earned in 2014 were $246 million (8.3%) and $100 million (3.3%), respectively. The increases were primarily due to treaty
participations as well as growth in our facultative and primary casualty businesses. Our underwriters continue to exercise
discipline by declining business where prices are deemed inadequate and remain prepared to increase premium volume when
appropriate prices are attained relative to the risks assumed.
Our combined property/casualty business produced pre-tax underwriting gains in 2014 of $170 million compared to $148
million in 2013. In 2014 and 2013, our property business generated pre-tax underwriting gains of $466 million and
$153 million, respectively. Underwriting results in 2014 reflected no significant catastrophe events as compared to 2013 which
included $400 million of catastrophe losses primarily attributable to a hailstorm ($280 million) and floods ($120 million) in
Europe. The timing and magnitude of catastrophe and large individual losses has produced and is expected to continue to
produce significant volatility in periodic underwriting results. In both periods, property results also benefitted from reductions
of estimated ultimate losses for prior years’ exposures. The favorable development in each period was primarily attributable to
lower than expected losses reported from ceding companies.
Our casualty/workers’ compensation business produced pre-tax underwriting losses of $296 million in 2014 as compared
to $5 million in 2013. Casualty/workers’ compensation underwriting results included gains from reductions of estimated
ultimate losses on prior years’ business of $123 million in 2014 and $354 million in 2013. Casualty losses tend to be long-tail
and it should not be assumed that favorable loss experience in a given period means that the ultimate liability estimates
currently established will continue to develop favorably. The pre-tax underwriting losses in each year also reflected recurring
charges related to discount accretion on workers’ compensation liabilities and amortization of deferred charges pertaining to
retroactive reinsurance contracts. These charges aggregated $138 million in 2014 and $141 million in 2013.
Property/casualty premiums written in 2013 were relatively unchanged while premiums earned increased $103 million
(3.5%) when compared to 2012. Excluding the effects of foreign currency exchange rate changes, premiums written and earned
in 2013 increased $8 million (0.3%) and $83 million (2.9%), respectively, versus 2012. This was primarily due to increases in
European treaty business.
Our combined property/casualty operations generated pre-tax underwriting gains of $148 million in 2013 and $399 million
in 2012. Property underwriting gains in 2013 were $153 million, a decline of $199 million from 2012. Property results in 2013
included $400 million of catastrophe losses primarily from a storm and floods in Europe while results in 2012 included $266
million of catastrophe losses, which were primarily attributable to Hurricane Sandy ($226 million). In each year, property
results also benefitted from reductions of estimated ultimate losses for prior years’ business.
In 2013, casualty/workers’ compensation business generated an underwriting loss of $5 million compared to an
underwriting gain of $47 million in 2012. In each year, results benefitted from lower than expected losses from prior years’
casualty business. Underwriting results also included charges for discount accretion on workers’ compensation liabilities and
deferred charge amortization of $141 million in 2013 and $158 million in 2012.
89