Berkshire Hathaway 2014 Annual Report Download - page 85
Download and view the complete annual report
Please find page 85 of the 2014 Berkshire Hathaway annual report below. You can navigate through the pages in the report by either clicking on the pages listed below, or by using the keyword search tool below to find specific information within the annual report.-
 1
1 -
2
-
3
-
4
-
5
-
6
-
7
-
8
-
9
-
10
-
11
-
12
-
13
-
14
-
15
-
16
-
17
-
18
-
19
-
20
-
21
-
22
-
23
-
24
-
25
-
26
-
27
-
28
-
29
-
30
-
31
-
32
-
33
-
34
-
35
-
36
-
37
-
38
-
39
-
40
-
41
-
42
-
43
-
44
-
45
-
46
-
47
-
48
-
49
-
50
-
51
-
52
-
53
-
54
-
55
-
56
-
57
-
58
-
59
-
60
-
61
-
62
-
63
-
64
-
65
-
66
-
67
-
68
-
69
-
70
-
71
-
72
-
73
-
74
-
 75
75 -
 76
76 -
 77
77 -
 78
78 -
 79
79 -
 80
80 -
 81
81 -
 82
82 -
 83
83 -
 84
84 -
 85
85 -
 86
86 -
 87
87 -
 88
88 -
 89
89 -
 90
90 -
 91
91 -
 92
92 -
 93
93 -
 94
94 -
 95
95 -
96
-
97
-
98
-
99
-
100
-
101
-
102
-
103
-
104
-
105
-
106
-
107
-
108
-
109
-
110
-
111
-
112
-
113
-
114
-
115
-
116
-
117
-
118
-
119
-
120
-
121
-
122
-
123
-
124
-
125
-
126
-
127
-
128
-
129
-
130
-
131
-
132
-
133
-
134
-
135
-
136
-
137
-
138
-
139
-
140
-
141
-
142
-
143
-
144
-
145
-
146
-
147
-
148
 |
 |

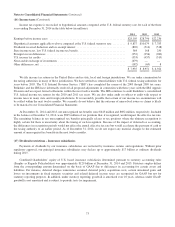
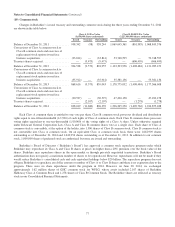
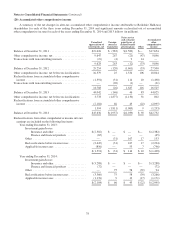
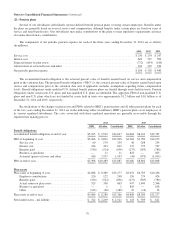
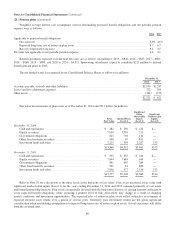
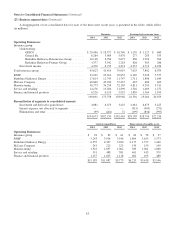
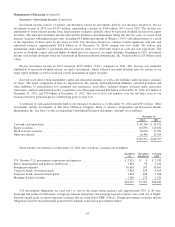
Notes to Consolidated Financial Statements (Continued)
(23) Business segment data (Continued)
A disaggregation of our consolidated data for each of the three most recent years is presented in the tables which follow
(in millions).
Revenues Earnings before income taxes
2014 2013 2012 2014 2013 2012
Operating Businesses:
Insurance group:
Underwriting:
GEICO ................................... $ 20,496 $ 18,572 $ 16,740 $ 1,159 $ 1,127 $ 680
General Re ................................ 6,264 5,984 5,870 277 283 355
Berkshire Hathaway Reinsurance Group ........ 10,116 8,786 9,672 606 1,294 304
Berkshire Hathaway Primary Group ............ 4,377 3,342 2,263 626 385 286
Investment income ............................. 4,370 4,735 4,474 4,357 4,713 4,454
Total insurance group ............................... 45,623 41,419 39,019 7,025 7,802 6,079
BNSF ............................................ 23,239 22,014 20,835 6,169 5,928 5,377
Berkshire Hathaway Energy .......................... 17,614 12,743 11,747 2,711 1,806 1,644
McLane Company .................................. 46,640 45,930 37,437 435 486 403
Manufacturing ..................................... 36,773 34,258 32,105 4,811 4,205 3,911
Service and retailing ................................ 14,276 13,284 11,890 1,546 1,469 1,272
Finance and financial products ........................ 6,526 6,110 5,933 1,839 1,564 1,393
190,691 175,758 158,966 24,536 23,260 20,079
Reconciliation of segments to consolidated amount:
Investment and derivative gains/losses .............. 4,081 6,673 3,425 4,081 6,673 3,425
Interest expense, not allocated to segments .......... — — — (313) (303) (271)
Eliminations and other .......................... (99) (281) 72 (199) (834) (997)
$194,673 $182,150 $162,463 $28,105 $28,796 $22,236
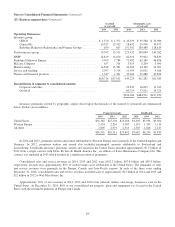
Capital expenditures Depreciation of tangible assets
2014 2013 2012 2014 2013 2012
Operating Businesses:
Insurance group .................................... $ 94 $ 89 $ 61 $ 69 $ 58 $ 57
BNSF ............................................ 5,243 3,918 3,548 1,804 1,655 1,573
Berkshire Hathaway Energy .......................... 6,555 4,307 3,380 2,177 1,577 1,440
McLane Company .................................. 241 225 225 159 159 149
Manufacturing ..................................... 1,324 1,037 1,062 943 1,061 1,068
Service and retailing ................................ 591 488 381 461 413 379
Finance and financial products ........................ 1,137 1,023 1,118 602 495 480
$15,185 $11,087 $9,775 $6,215 $5,418 $5,146
83